If you feel like spring arrives earlier at your place than at your friend’s a few hours away, it might not be your imagination. A new global study using 20 years of satellite data shows that Earth’s seasons do not follow one neat four-part calendar. Instead, the planet is broken into thousands of local “clocks,” some of them badly out of sync with their neighbors.
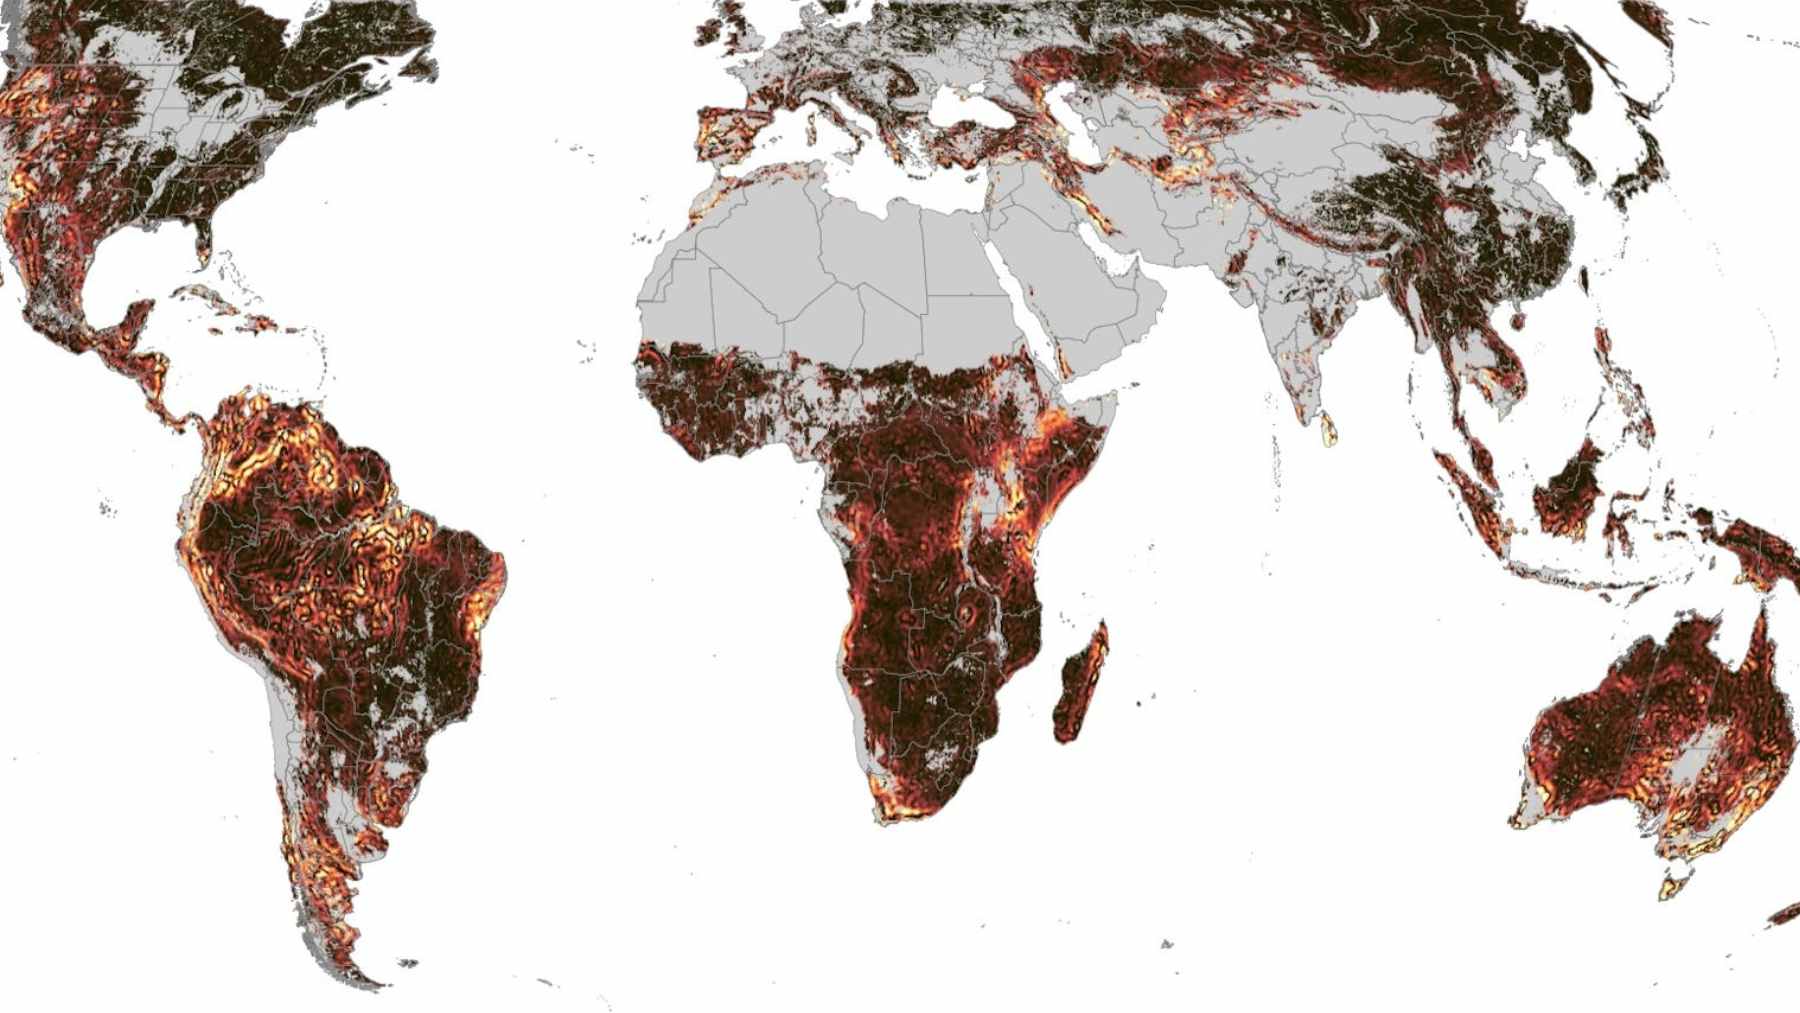
Researchers built the most detailed map so far of how plant growth waxes and wanes through the year on land. In that map they identified “hotspots of seasonal asynchrony,” places where nearby ecosystems can be weeks or even months out of phase in their seasonal timing.
Many of these hotspots appear in Mediterranean climate regions such as California, central Chile, South Africa’s Cape region, southern Australia, and around the Mediterranean Sea, as well as along tropical mountain ranges from the Andes to East Africa.
Watching nature’s calendar from orbit
The science behind this is something called phenology, which tracks the timing of natural events like leafing, flowering, or migration. For centuries, people kept phenology records in notebooks and almanacs. Now, satellites add a bird’s eye view, watching how green plants become through time and turning that into a planet-wide calendar of growth.
Earlier satellite studies often assumed a simple pattern with one clear growing season. That works in snowy temperate zones but fails in the tropics and drylands, where plants may respond more to rainfall pulses or shifting clouds than to temperature.
The new work avoids those assumptions. The team analyzed two decades of near infrared “greenness” data at roughly five kilometer resolution and cross checked it with independent satellite measurements of plant fluorescence and on the ground observations, then used statistical models to tease out each location’s characteristic yearly growth curve.
Double peaks, drylands, and desert neighbors
Once the researchers animated those curves, a more complex picture appeared. In the five Mediterranean climate regions of the world, non-forest areas tend to green up in late winter and spring, while nearby forests peak about two months later, creating a “double peak” pattern in the same broad region. Out in the surrounding drylands, plant growth may instead track summer monsoon rains.
That is why two desert cities such as Phoenix and Tucson, only about 160 kilometers apart, can sit in quite different seasonal worlds.
In tropical mountains the story becomes even more intricate. There, steep slopes and shifting clouds can scramble when sunlight and moisture arrive through the year.
The study finds that these highland regions often show strong seasonal asynchrony, with neighboring valleys and ridges following very different schedules. In many of these places, water and light, rather than temperature, are the main drivers of plant growth.
Why this matters for biodiversity
The hotspots of seasonal asynchrony line up strikingly with many of Earth’s biodiversity hotspots. When plant growth peaks at different times from one valley to the next, food and other resources for animals peak at different times as well.
That can push populations of the same species to breed at different moments, even when they live relatively close together. Over long periods, such timing gaps can reduce interbreeding and nudge populations along separate evolutionary paths.

The researchers tested this idea using data on flowering dates, genetic differences, and even harvest records. They found that their seasonal map can predict sharp breaks in flowering time and genetic relatedness for a wide variety of plants and animals. In Colombia, for example, coffee farms that are only a day’s drive apart across the mountains can have harvest seasons as out of phase as farms in opposite hemispheres.
From climate change to your grocery cart
This new atlas of Earth’s seasonal timing is more than a pretty animation. For ecologists, it offers a way to pinpoint where wildlife migrations might be most vulnerable if climate change shifts local calendars. For farmers and planners, it can reveal where planting schedules, irrigation needs, or pest outbreaks will not match the “average” pattern for a region because the local season already runs on its own clock.
The same information could help disease experts track when conditions are ripe for mosquitoes or crop pathogens in specific landscapes.
At the end of the day, the study suggests that Earth’s seasons behave less like a single ticking metronome and more like a patchwork of overlapping rhythms. Learning to read that patchwork may be essential for protecting biodiversity, managing food systems, and understanding how a warming climate reshapes the living world around us.
The study was published in the journal Nature.