Most coastal maps begin with a quiet assumption. They treat sea level as a clean zero line, then measure land above or below it. A new analysis says that starting line was often placed too low, meaning more land and more people may already be closer to today’s sea level than many risk maps have shown.
This is not a claim that the ocean suddenly jumped higher this week. The problem is more basic, and in some ways more troubling. If the wrong baseline is used, the map can look reassuring while the shoreline outside people’s homes, farms, roads, and ports tells a different story.

The wrong zero line
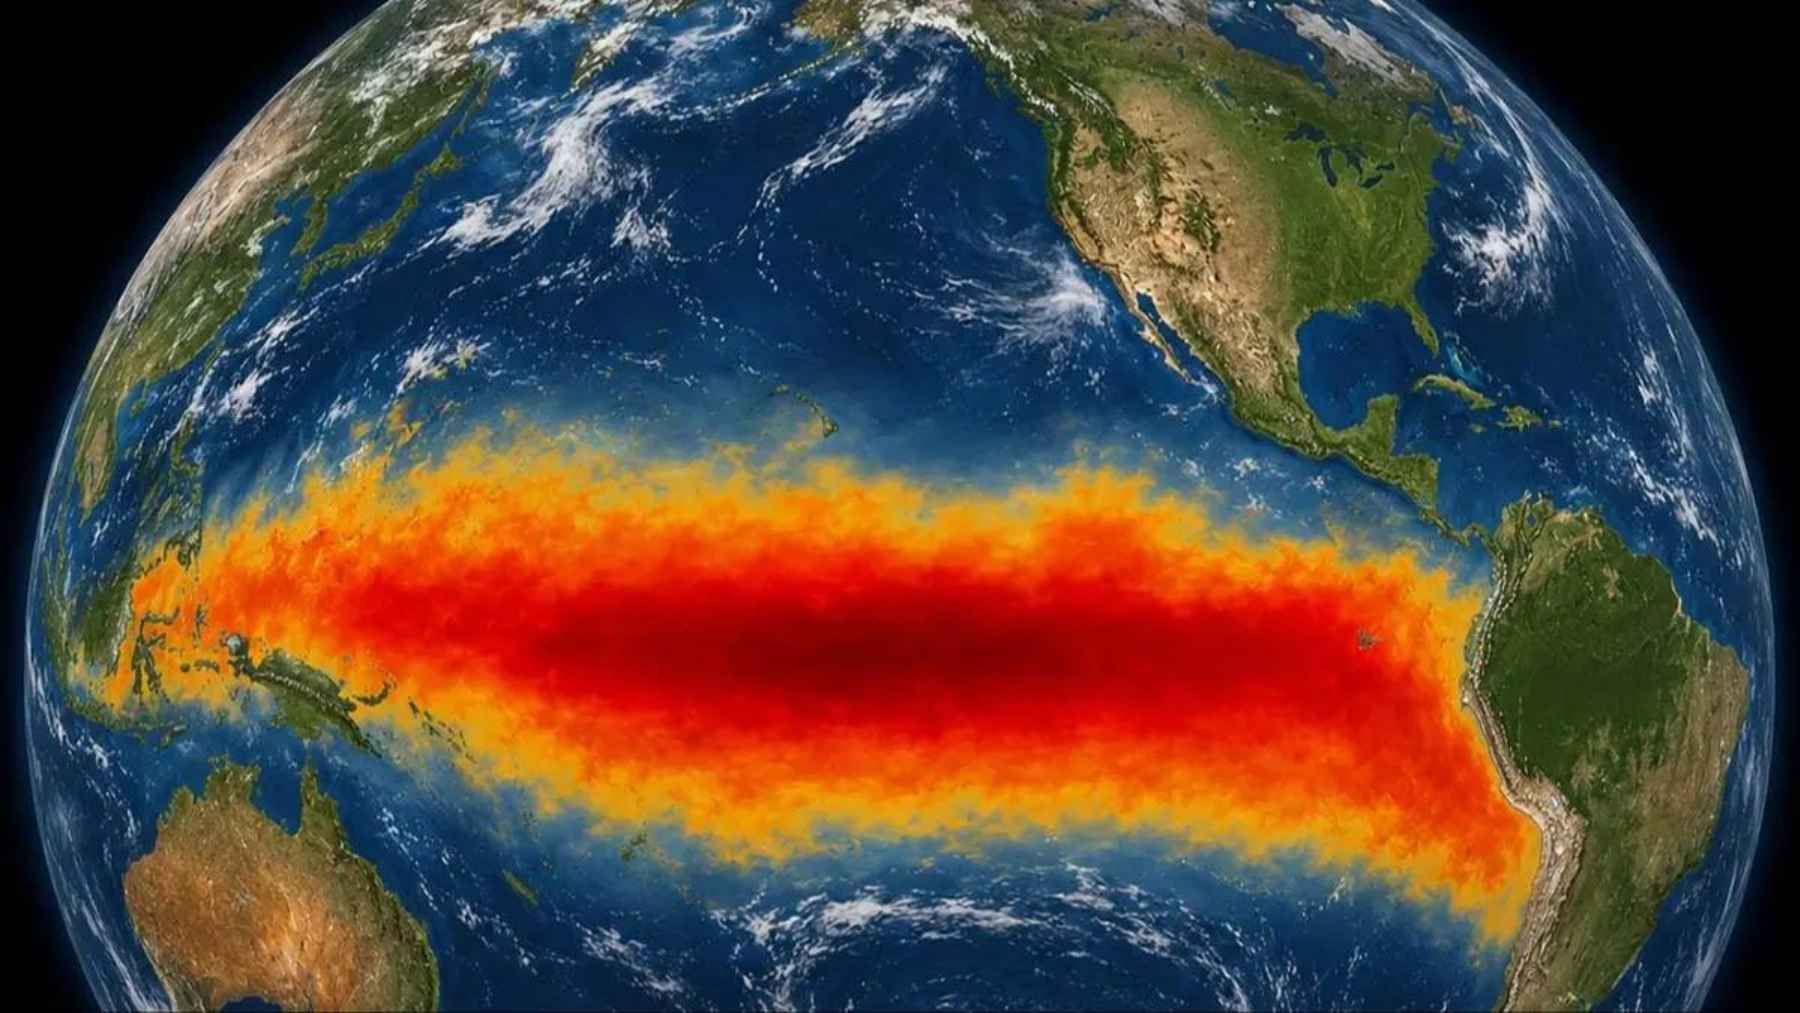
At the center of the issue is something called a geoid. It is a gravity-based model of Earth’s sea surface, useful for mapping but not the same as the water lapping at a local harbor. Think of it as a carefully drawn reference surface, not the real ocean on a windy day.
Real coastlines are pushed around by currents, winds, tides, water temperature, and salt content. Those forces can lift or lower local average sea level compared with the model. So a precise global zero can still be the wrong local zero.
Hundreds of studies affected
Katharina Seeger and Philip S.J. Minderhoud led the work, with affiliations across Wageningen University & Research, the University of Cologne, the University of Padova, and Deltares Research Institute. They evaluated 385 peer-reviewed studies on sea-level rise and coastal flooding published from 2009 to 2025. More than 99% handled sea-level and land-height data inadequately, and 90% relied on geoid models instead of measured sea levels.
That kind of error can spread quietly. One paper uses a familiar dataset, another paper builds on it, and soon the shortcut becomes part of the scientific furniture. In an institutional release, he said, “It has taken years to put all the pieces of the puzzle together.”
Where the gap is biggest
On average, measured coastal sea level was about 8 to 12 inches higher than the baseline often used in risk assessments. In many places, that sounds like a curb, not a crisis, but along a very flat coast, a few inches can change which streets, fields, and homes fall into the danger zone.
The mismatch is not evenly spread. Data-rich parts of North America and Western Europe tend to line up better because they have long records and denser measurements. In Southeast Asia, Pacific islands, and the wider Indo-Pacific, measured sea level can sit more than 3.3 feet above the assumed reference in some locations.
Millions added to exposure
With a scenario of about 3.3 feet of relative sea-level rise, the corrected maps found 31% to 37% more land and 48%-68% more people below sea level than geoid-based methods suggested. The population estimate rose to 77 million to 132 million people. The area estimate rose from about 113,700 to 166,400 square miles to about 177,600 to 258,700 square miles.
Those numbers do not predict which neighborhoods flood first. Sea walls, pumps, dunes, wetlands, storm tracks, and evacuation plans all matter. They do, however, change the baseline for decisions that affect everyday life, from a flooded road after a storm to insurance costs on a coastal home.
The Mekong warning
A 2019 Nature Communications study found that the Vietnamese Mekong Delta sat about 2.6 feet above local sea level on average, not about 8.5 feet as earlier global maps suggested. At the time, that looked like a major regional correction. Now it looks more like an early warning for low-lying deltas elsewhere.
Deltas are especially sensitive because they are flat, densely settled, and in many cases sinking as groundwater is pumped or sediment is trapped upstream. A few feet on a map can decide whether a rice field, a road, or a neighborhood appears safely above the water. Small difference, big consequences.
Why planners should care
Coastal-risk maps guide seawalls, drainage systems, roads, ports, real estate rules, and emergency routes. If the starting water level is too low, a city may believe it has more time than it really does. That matters when budgets are tight and politics moves slowly.
Several reviewed papers also fed into major climate assessments, according to the Dutch Climate Risk Portal. The authors identified 46 evaluated studies cited in the latest Intergovernmental Panel on Climate Change (IPCC) Sixth Assessment Report cycle, with many missing or mishandling sea-level reference details. That does not erase the value of those reports, but it does show how a technical blind spot can travel far.
IPCC public data show the likely global average sea-level rise by 2100 ranging from about 11 inches under a very low-emissions pathway to about 3.3 feet under a very high-emissions one, compared with 1995 to 2014. If today’s baseline is already higher in many places, that future rise starts from a more dangerous floor.
A cleaner map for the coast
The authors did not just point to a problem. They published corrected coastal elevation datasets that combine land height with measured sea surface information, giving future assessments a common starting point. The hope, according to the release, is to “save many researchers complicated calculations” and support more realistic analysis.
Better standards may sound dull. However, for a mayor choosing where to raise a road, or a family trying to understand flood risk, the zero line on a map is not just a technical detail. It is the difference between planning early and being surprised later.
The main study has been published in Nature.