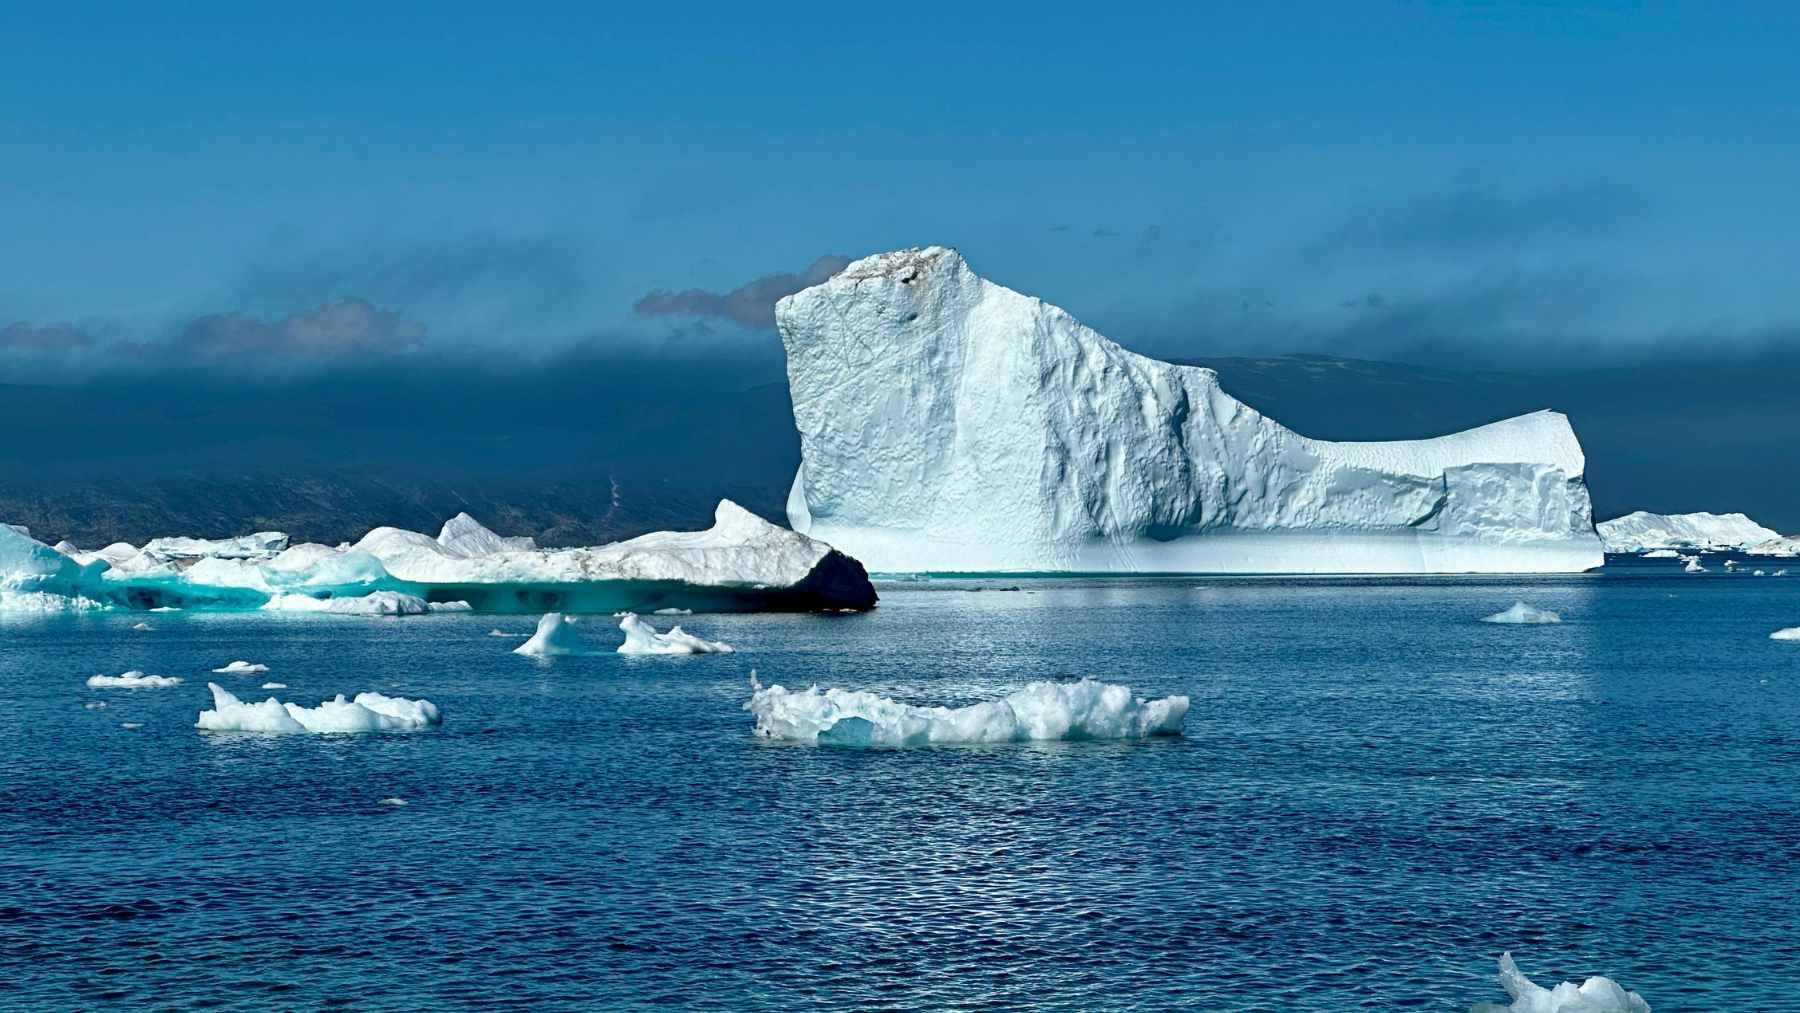
Greenland’s ice sheet is no longer sending a slow, distant warning. A Nature Communications study led by University of Barcelona researchers found that the trend in extreme meltwater production has jumped from 12.7 gigatons per decade from 1950 to 2023 to 82.4 gigatons per decade since 1990, equal to about 14.0 billion to 90.8 billion U.S. tons.
That is not a small Arctic footnote. It means the ice sheet is producing extreme meltwater at a far faster pace than in earlier decades, while the area hit by these events is spreading by about 1.08 million square miles per decade.
For anyone living near the coast, that distant white landscape is connected to seawalls, flood insurance, storm drains, and the street outside after a heavy tide.
Greenland’s thaw is speeding up
The research team analyzed extreme melting events from 1950 to 2023 using satellite observations, a regional climate model, and an analog method that compares similar weather patterns across time. Their conclusion was blunt in scientific terms. Extreme melt has become more frequent, more extensive, and more severe.
Seven of the ten most extreme melting episodes in the record occurred after 2000. The events of August 2012, July 2019, and July 2021 stood out because the study found no comparable dynamic precedents for them, meaning the same kind of atmospheric setup had not produced a matching event in the historical record.
So, what changed? In practical terms, Greenland is now entering extreme melt episodes with a warmer background climate. The weather patterns matter, but the atmosphere has become a hotter stage for the same drama.
A number that is hard to picture
A gigaton is not a kitchen-table unit. One gigaton is one billion metric tons, or about 1.1 billion U.S. tons, so the recent trend of 82.4 gigatons per decade is roughly 90.8 billion U.S. tons per decade.
The highest peak daily meltwater in the study came during the August 2019 and July 2012 events, reaching 17 gigatons per day, or about 18.7 billion U.S. tons in a single day. Total accumulated meltwater during the July and August 2012 events each exceeded 250 gigatons, which is more than 275 billion U.S. tons.
That does not mean every drop instantly becomes sea-level rise, since ice sheets have complicated pathways for melting, refreezing, runoff, and ocean discharge. Still, it shows the scale of the pressure building on a system that helps regulate global sea level.
Northern Greenland is becoming a hotspot
The strongest changes are showing up in northern Greenland, a region that researchers now describe as one of the main hotspots for future intensification. The study found that thermodynamic processes, mostly linked to atmospheric warming, increased meltwater production by 25% when comparing similar circulation patterns with those from 1950 to 1975.
When all extreme events were included, the intensification reached 63%. That is a key point, because it suggests the problem is not only that unusual weather events happen. It is also that the same broad type of weather can now squeeze more meltwater out of the ice.
Josep Bonsoms, the lead author, warned in a statement by the University of Barcelona that “the rapid transformation of the ice sheet” carries global environmental consequences, including sea-level rise and possible changes in ocean circulation. It also places the Arctic more firmly in the middle of strategic and territorial debates.
Why coastal cities should care
NASA data show that Greenland shed about 264 gigatons of ice per year from 2002 to 2025, adding about 0.03 inches of water to global sea level each year. That may sound tiny, but sea-level rise is not felt as one neat number on a chart. It shows up as saltwater creeping into groundwater, higher storm surge, beach erosion, and sunny-day flooding when the weather looks perfectly normal.
The Greenland Ice Sheet contains enough frozen water to raise global sea level by about 24 feet if it were to melt completely, according to the National Oceanic and Atmospheric Administration (NOAA).
That is not a near-term forecast, and scientists are not saying it will happen this century. But even a small fraction matters when coastal roads, ports, subway tunnels, and homes are already built close to the water.
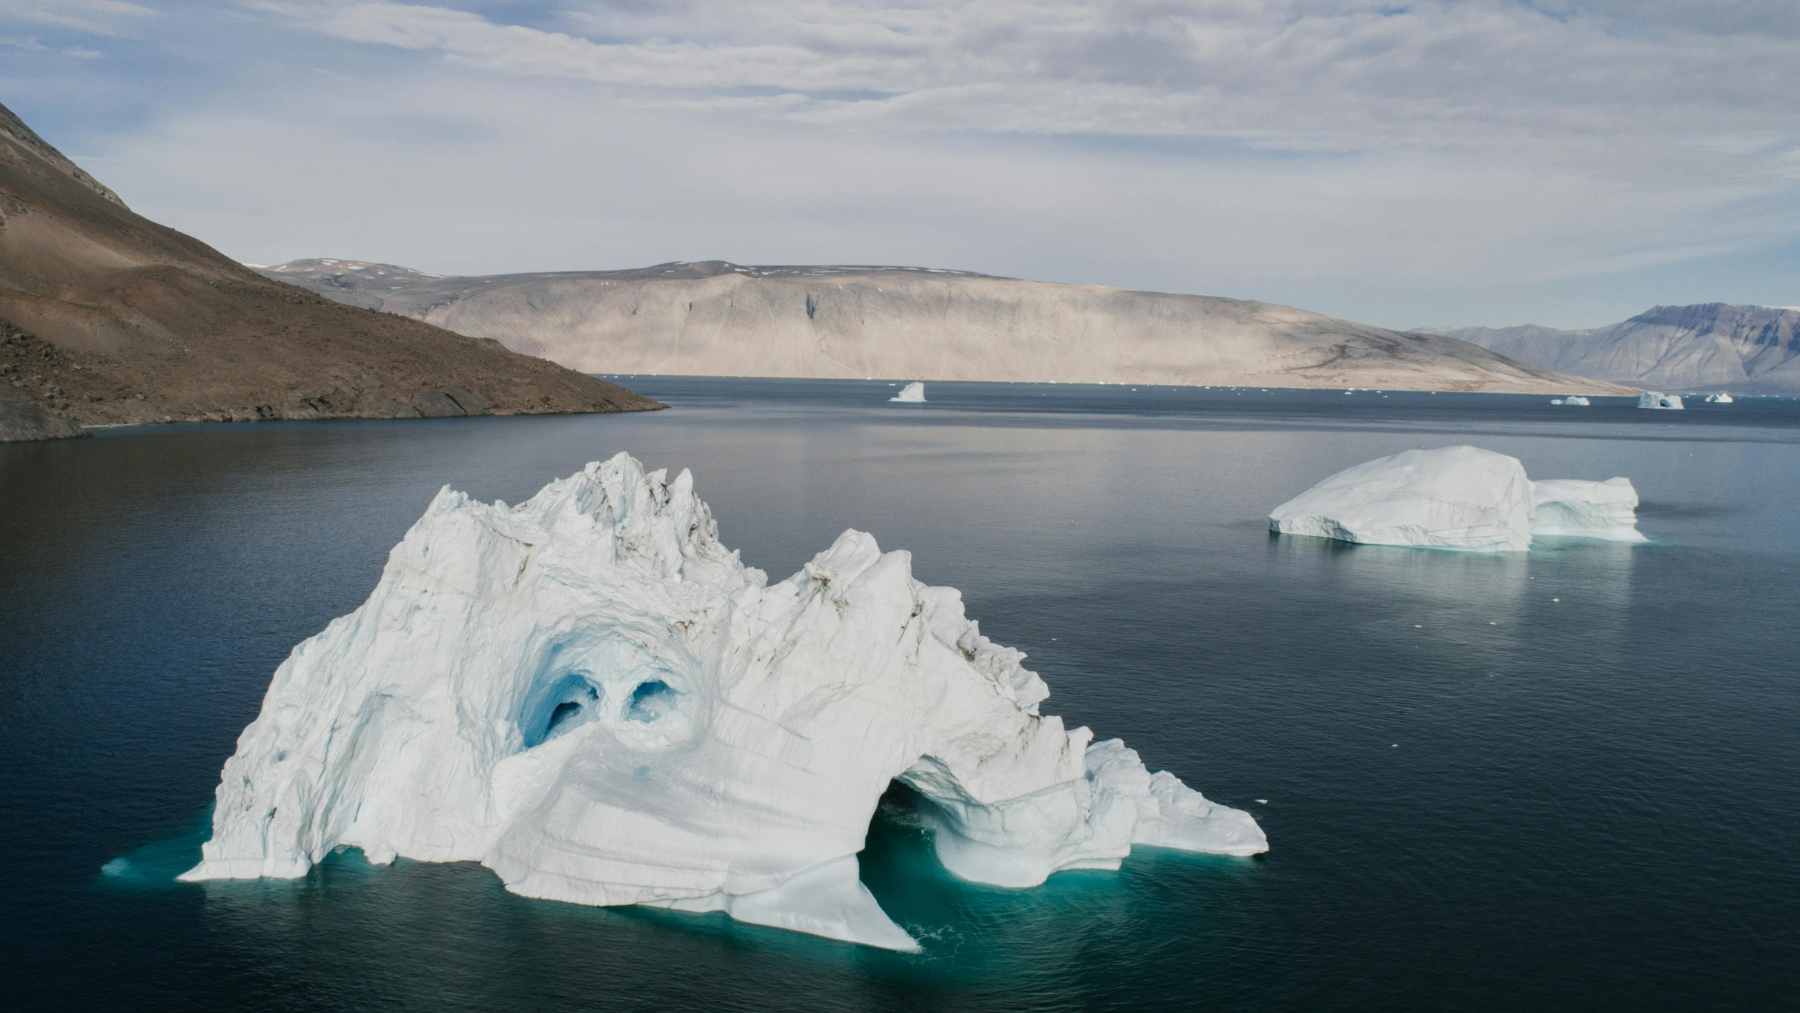
The Intergovernmental Panel on Climate Change’s (IPCC) assessed range for global mean sea-level rise by 2100 is about 11 to 22 inches under a very low emissions scenario, and about 25 to 40 inches under a very high emissions scenario. The trouble is, local impacts can feel sharper than the global average, especially where land is sinking or storms push water inland.
The next forecasts need to get sharper
The Nature Communications paper also looked ahead under high-emissions scenarios. Its projections suggest extreme meltwater anomalies could increase by up to 372% by 2100, with northern and northeastern sectors seeing some of the largest regional jumps.
That is where the science gets uncomfortable. Models have improved, but ice sheets do not behave like simple machines. Albedo, clouds, soot, snow cover, ocean heat, and the inner structure of the ice all help decide how much melting happens and how fast water escapes.
Better forecasts will not stop the ice from melting on their own. But they can give coastal planners more useful lead time, much like a better storm forecast helps people decide whether to move a car, board a window, or rethink a building code.
Greenland’s warning is simple
This study does not say Greenland is vanishing tomorrow. It says extreme melting has shifted into a new gear, and the change is large enough to matter far beyond the Arctic.
At the end of the day, the finding is about time. The more extreme melt accelerates, the less time coastal communities have to adapt, and the more important emissions choices become in shaping the next few decades.
The study was published in Nature Communications.