The satellite gave researchers a wide view, but it did not replace ocean instruments. Deep-ocean Assessment and Reporting of Tsunamis (DART) buoys helped record timing and wave height at key locations, offering another piece of the puzzle.
When the team compared earlier models with the DART records, two buoys did not line up as expected. One recorded the tsunami earlier than predicted, while another saw it later, which suggested the original earthquake source model needed adjustment.
By adding the buoy data into a new analysis, the researchers concluded that the rupture extended farther south than many initial models suggested. Instead of about 186 miles, the rupture length was closer to 249 miles. That is a big difference when communities are depending on forecasts measured in minutes.
Why older earthquakes still matter
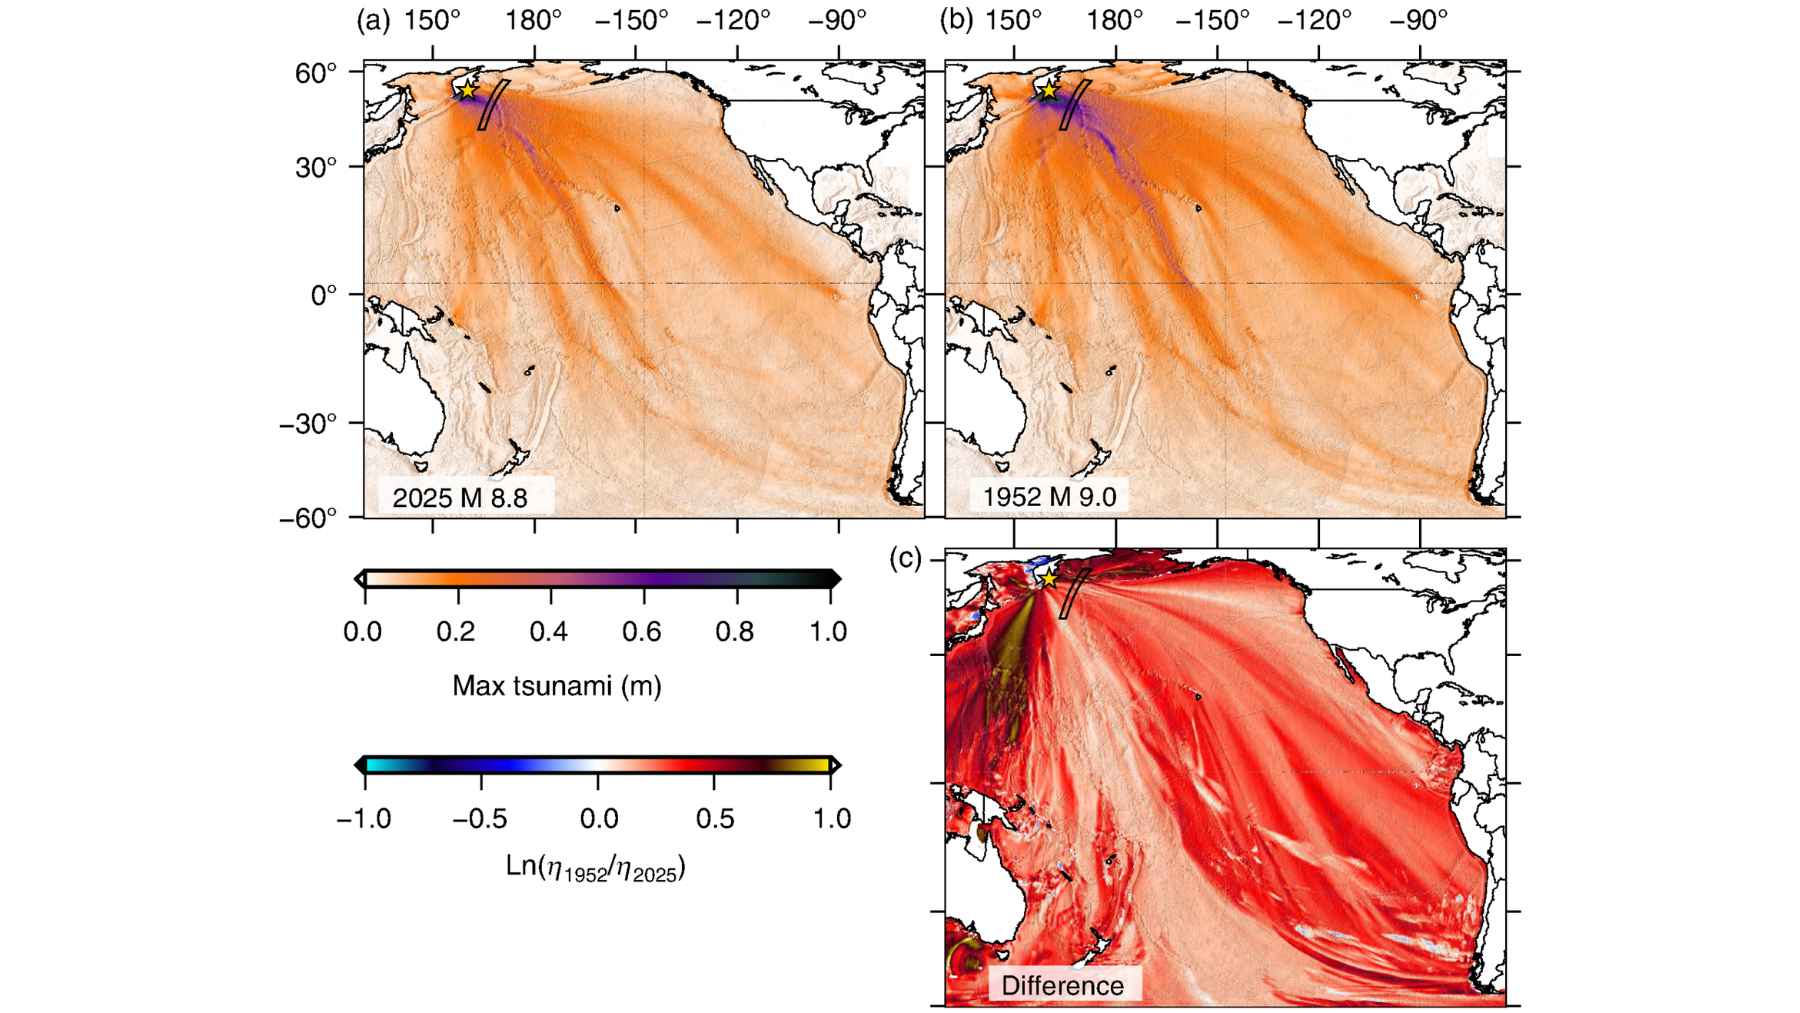
The Kuril-Kamchatka margin has a long history of powerful earthquakes and Pacific-wide tsunamis. A magnitude 9.0 earthquake in the same region in 1952 helped lead to the international Pacific warning system that was used during the 2025 event.
Read More: {{post_title link:post}}
That history is important because modern warning systems are not built from one instrument or one model. They are built from layers of evidence, including seismic records, ocean-bottom pressure data, satellite observations, and measurements of how land and seafloor deform.
At the end of the day, that is what this new study is really pointing toward. Tsunami science is getting better, yet the ocean is not simple. The more kinds of data scientists can combine, the better chance they have of seeing the full picture.
A turning point for tsunami forecasts
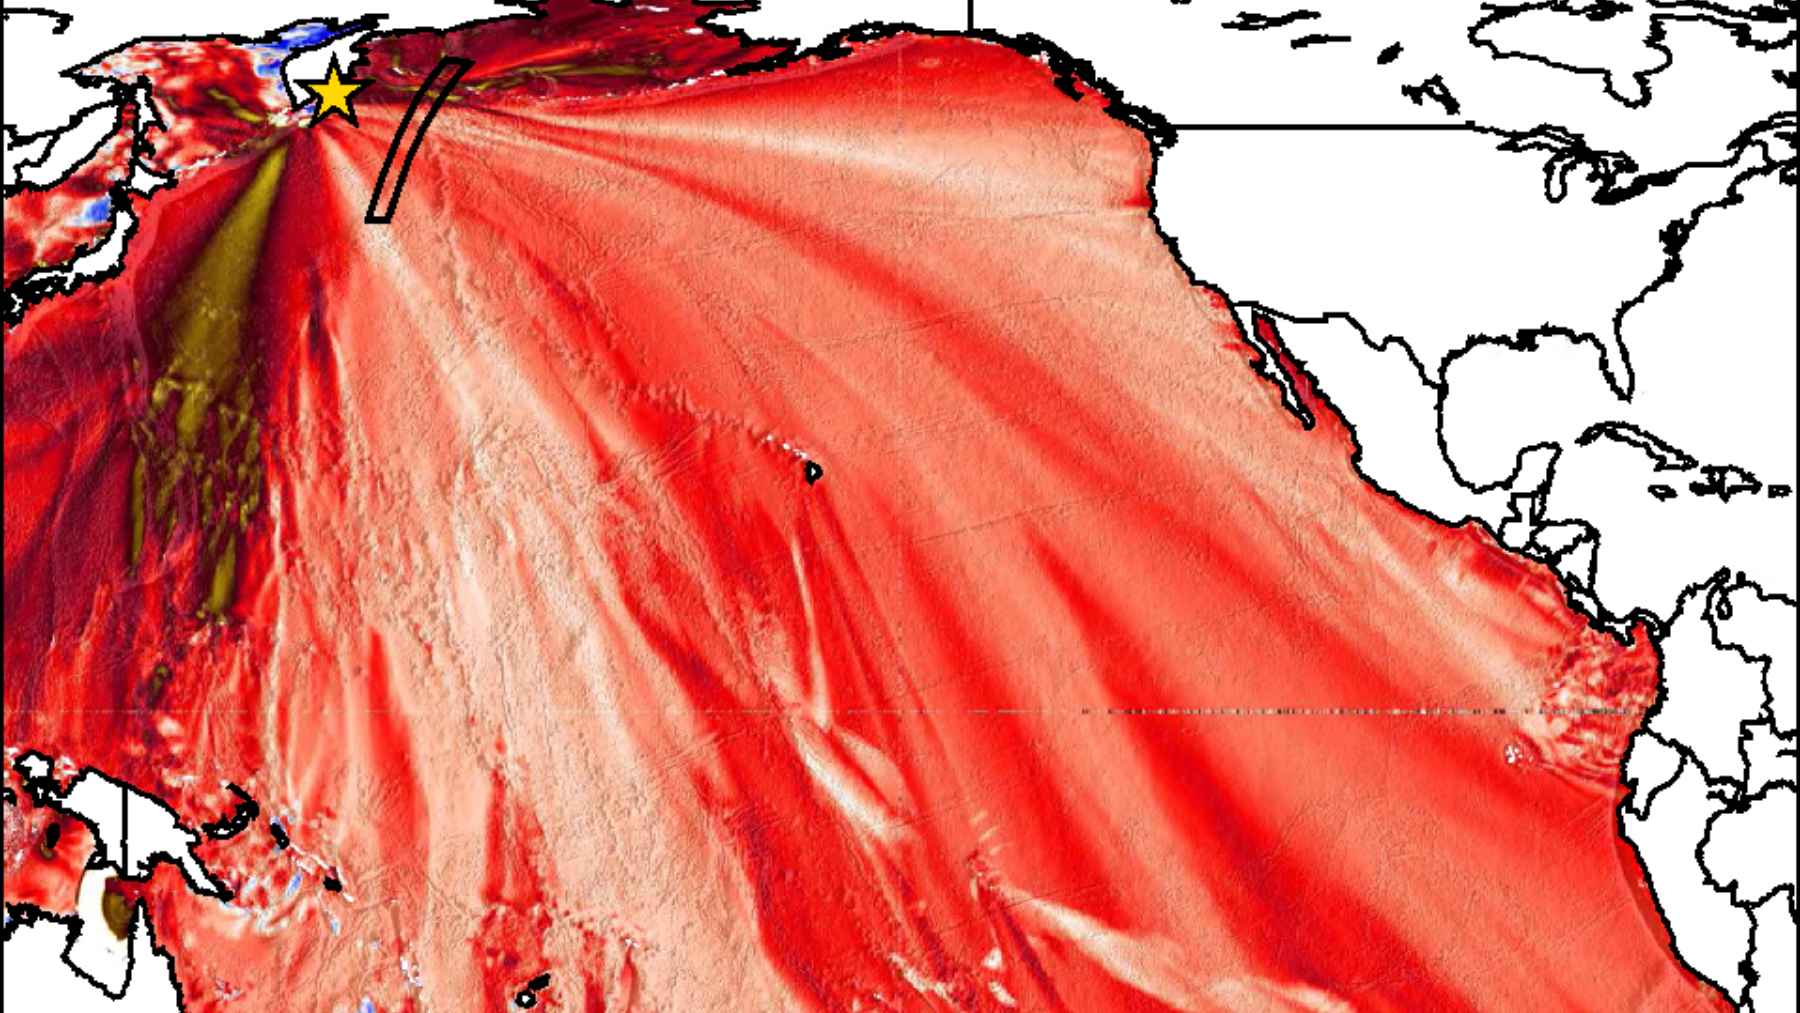
The Surface Water and Ocean Topography (SWOT) pass over the Kamchatka tsunami was partly luck, but the lesson is not just lucky timing. It shows that high-resolution satellite altimetry can reveal the internal structure of a tsunami in the open ocean, not merely confirm that one exists.
Researchers say these observations could eventually help improve real-time or near-real-time forecasting, though that is not how the system is currently used. For now, SWOT data are more valuable for improving models after an event, testing what worked, and spotting what the old tools missed.
Read More: {{post_title link:post}}
The trouble is, the clock moves fast during a tsunami. If dispersive wave trains can shift arrival times or change how energy reaches shore, then even small modeling gaps can become very real for people living near the water.
The ocean gave scientists a warning
The 2025 tsunami did not just cross the Pacific. It handed scientists a rare natural experiment, caught from above at the exact moment when wave physics was unfolding in the open ocean.
That is the quiet power of this image. It does not make tsunamis less dangerous, yett it can make them less mysterious.
Read More: {{post_title link:post}}
For coastal planners, emergency managers, and scientists, the message is pretty clear. The waves will not simplify themselves. Our forecasts have to get smarter.
The study was published in The Seismic Record.