Greenland and Antarctica lost 11.3 trillion metric tons of ice between 1979 and 2023, roughly 12.5 trillion US tons, according to a new record built from 42 satellite surveys and published Sept. 16 in Scientific Data. Faster-flowing glaciers drove 84 percent of that polar ice loss, and seas rose 1.24 inches (3.14 centimeters) as a result.
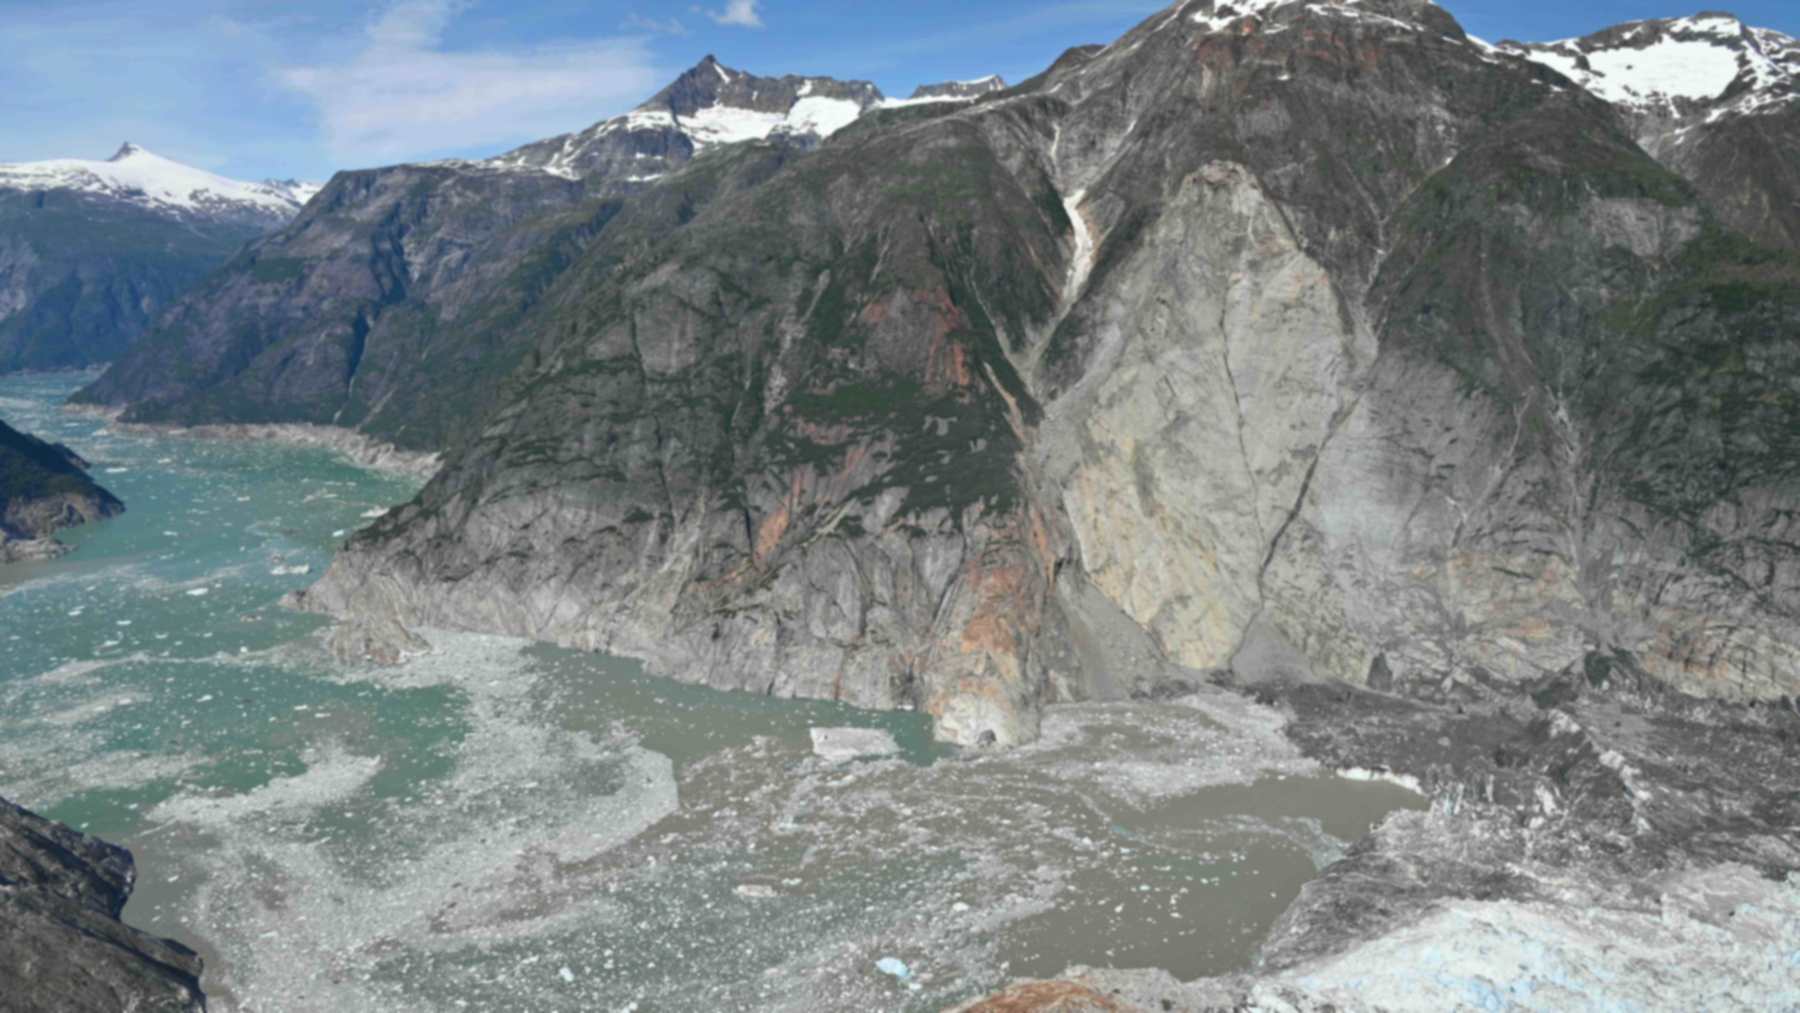
The team was led by Inès Otosaka, an assistant professor at Northumbria University in Newcastle upon Tyne, England. By reaching back to the 1970s, she said in a statement from Northumbria University, researchers can now see how the ice sheets have changed “across half a century.” A six-second clip released by the European Space Agency shows the kind of motion behind most of those losses, with ice streaming off Jakobshavn Glacier on Greenland’s west coast.
42 surveys from 27 satellites
The work comes from the Ice Sheet Mass Balance Inter-comparison Exercise, known as IMBIE. Otosaka led it with Andrew Shepherd, head of Northumbria’s School of Geography and Natural Sciences and IMBIE’s founder, and Tyler Sutterley of the University of Washington Applied Physics Laboratory. The new assessment adds early satellite measurements of glacier speed, going back to the start of the Landsat archive in 1972 for Greenland and in 1979 for Antarctica.
ESA, which backs IMBIE with NASA, listed some of the 27 missions in its announcement of the results: ESA’s CryoSat, the Copernicus Sentinels, the US-German GRACE satellites and early Landsat. The team compared 42 independent surveys, 23 for Greenland and 19 for Antarctica. Sutterley called it the most robust assessment of ice sheet mass balance produced so far.
Glaciers pushed the ice into the sea
Ice sheets gain mass mainly from snowfall and lose it through glacier discharge, melting and surface runoff. The team used regional climate models of snowfall and surface melt, and put the rest down to ice flow. Glacier dynamics turned out to drive 84 percent of the 11,309 billion metric tons lost.
More than four-fifths of the ice “was discharged into the ocean by faster-flowing glaciers, rather than melted at the surface,” Otosaka said. That, she added, shows the long-term trend is driven by the ice sheets’ response to a warming ocean. Greenland added 0.71 inch (18.1 millimeters) to the seas, and Antarctica added 0.52 inch (13.3 millimeters).
Greenland’s decade of extreme melt
Greenland was close to balance in the 1970s. It lost about 60 billion metric tons a year in the 1980s and 57 billion in the 1990s. In the 2000s, the rate tripled to 192 billion metric tons a year, and in the 2010s it hit 264 billion during what ESA describes as a decade of repeated extreme summer melting.
That was the first decade in which losses from reduced surface mass balance, the snow an ice sheet gains minus what it loses at the surface, exceeded losses from ice flow. Over the whole record, Greenland lost 6,215 billion metric tons, 67 percent of it from increased ice discharge and 33 percent from reduced surface mass balance. The losses have not stopped, and satellites logged a 29th straight year of net loss on Greenland that ended in August 2025.
West Antarctica sped up in every decade
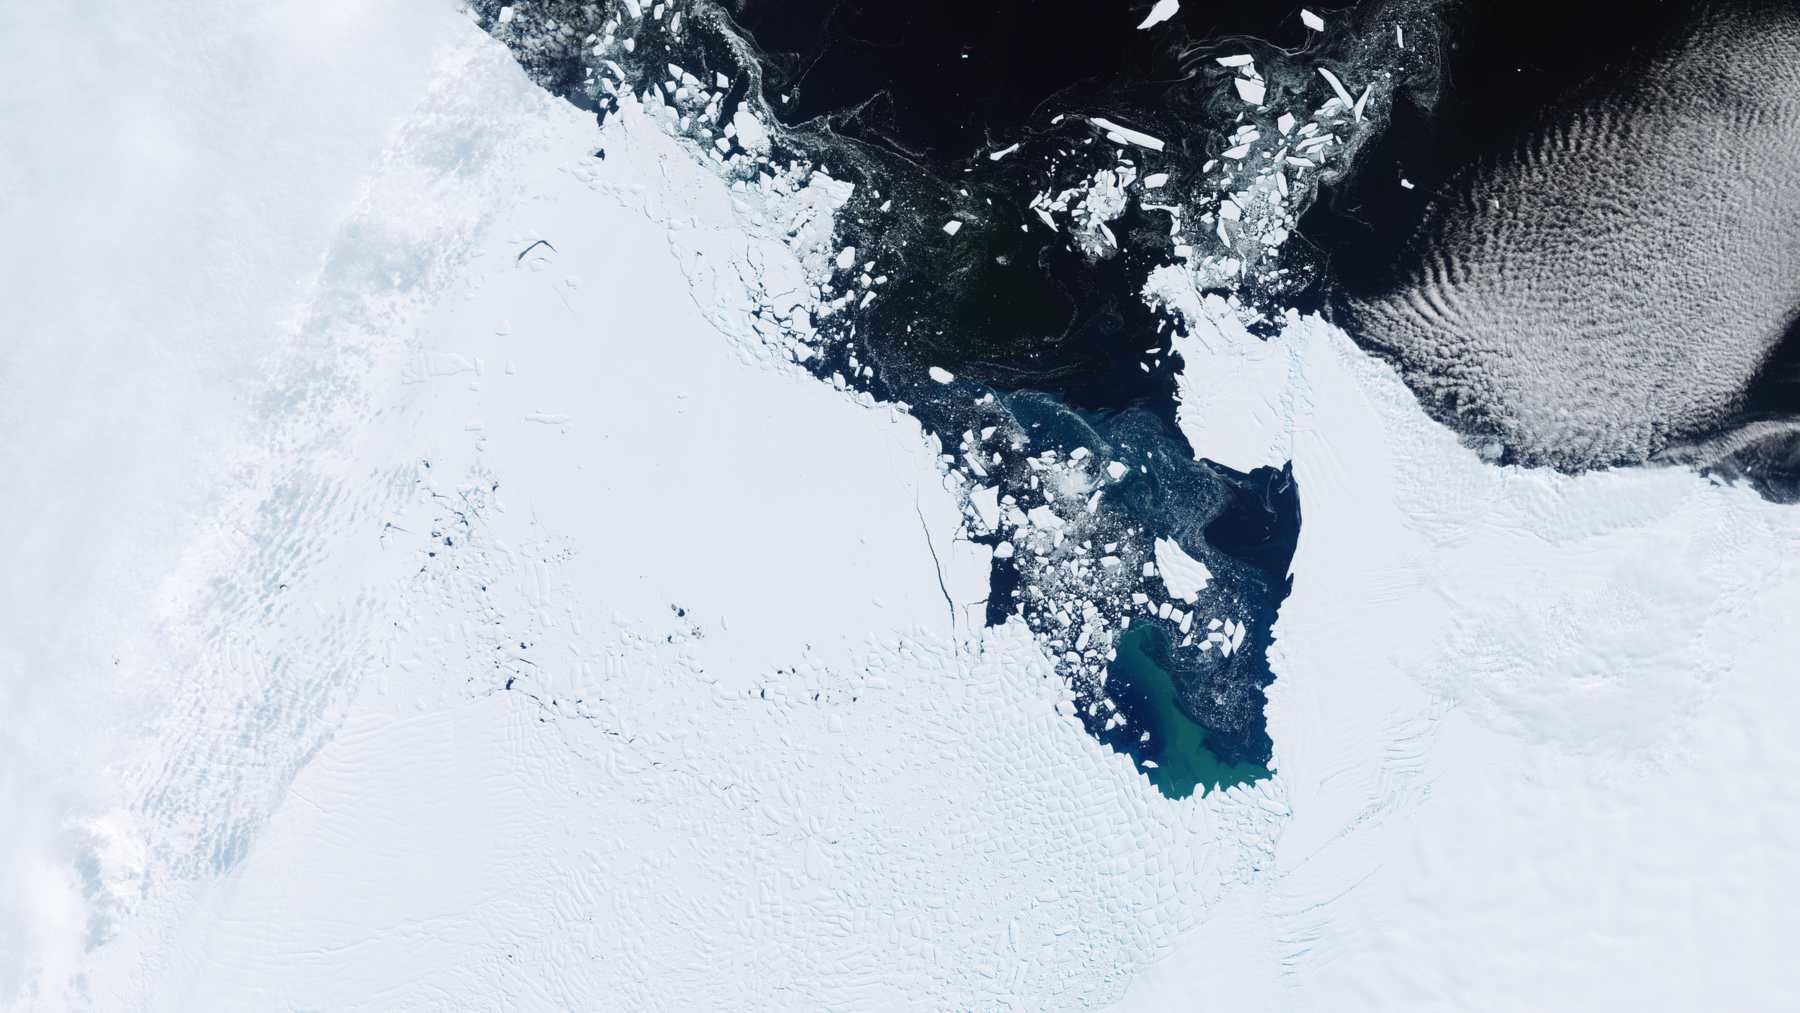
Antarctica’s annual losses rose from around 48 billion metric tons in the 1980s to 202 billion in the 2010s, according to ESA. Unlike Greenland’s, its net loss came entirely from ocean-driven melting and faster outlet glaciers. Most of it comes from West Antarctica, where losses climbed from 29 billion metric tons a year to 163 billion over the same period.
ESA points to two glaciers in particular, the accelerating Pine Island and Thwaites. Researchers have tracked warm water eroding the base of Thwaites and Pine Island in the Amundsen Sea. Antarctica also looks worse than in the last IMBIE report. For 1992 to 2020, the new figure is 140 billion metric tons a year, up from 92 billion.
Overall ice loss slowed between 2020 and 2023, ESA wrote. Record snowfall in 2022 and 2023 gave East Antarctica a net gain of 92 billion metric tons a year over those four years, enough to offset some of the glacier losses elsewhere. Other satellite work has also logged a separate record jump in Antarctic ice.
West Antarctica’s glaciers did not slow down. Their ice discharge rose another 38 percent in the last four years of the survey, though more snowfall offset the increase. In Greenland, a run of mild summers roughly halved surface melting, and the loss fell to 199 billion metric tons a year. Northumbria said scientists see these as “short-term fluctuations against a clear long-term trend, not a reversal of ice loss.”
What three centimeters means on the coast
The two ice sheets now account for about a quarter of global sea-level rise. In the study’s data, 360 billion metric tons of lost ice equals 1 millimeter (0.04 inch) of higher seas.
“Three centimetres of sea level rise may sound small, but that puts another six to nine million people at risk of coastal flooding and erosion,” Shepherd said.
The ice sheets’ response to warming is the single largest source of uncertainty in sea level projections, the university noted. High-end estimates of sea-level rise by 2150 grow by a factor of 2.6 once the risk of ice-sheet instability is included. A separate model now suggests Thwaites alone could add up to about 1.2 inches to global seas by 2100.
Limits of the record
The tally counts only ice that raises sea level. It leaves out ice lost through ice shelf thinning or retreat, and the retreat of ice grounded below sea level, the authors write.
East Antarctica is the weak spot. There, the three measurement techniques “disagree on even the sign of the mass change,” so they do not agree on whether the region is gaining or losing ice. Only one Antarctic estimate came from glacier flow, which may slightly underestimate gains in the east, and the early years carry more uncertainty because missing velocity images had to be filled in by interpolation.
The full study was published in Scientific Data. The dataset is open, with yearly rates for Greenland, Antarctica and its three regions through 2023.
Image: contains modified Copernicus Sentinel data (2026), processed by ESA, CC BY-SA 3.0 IGO