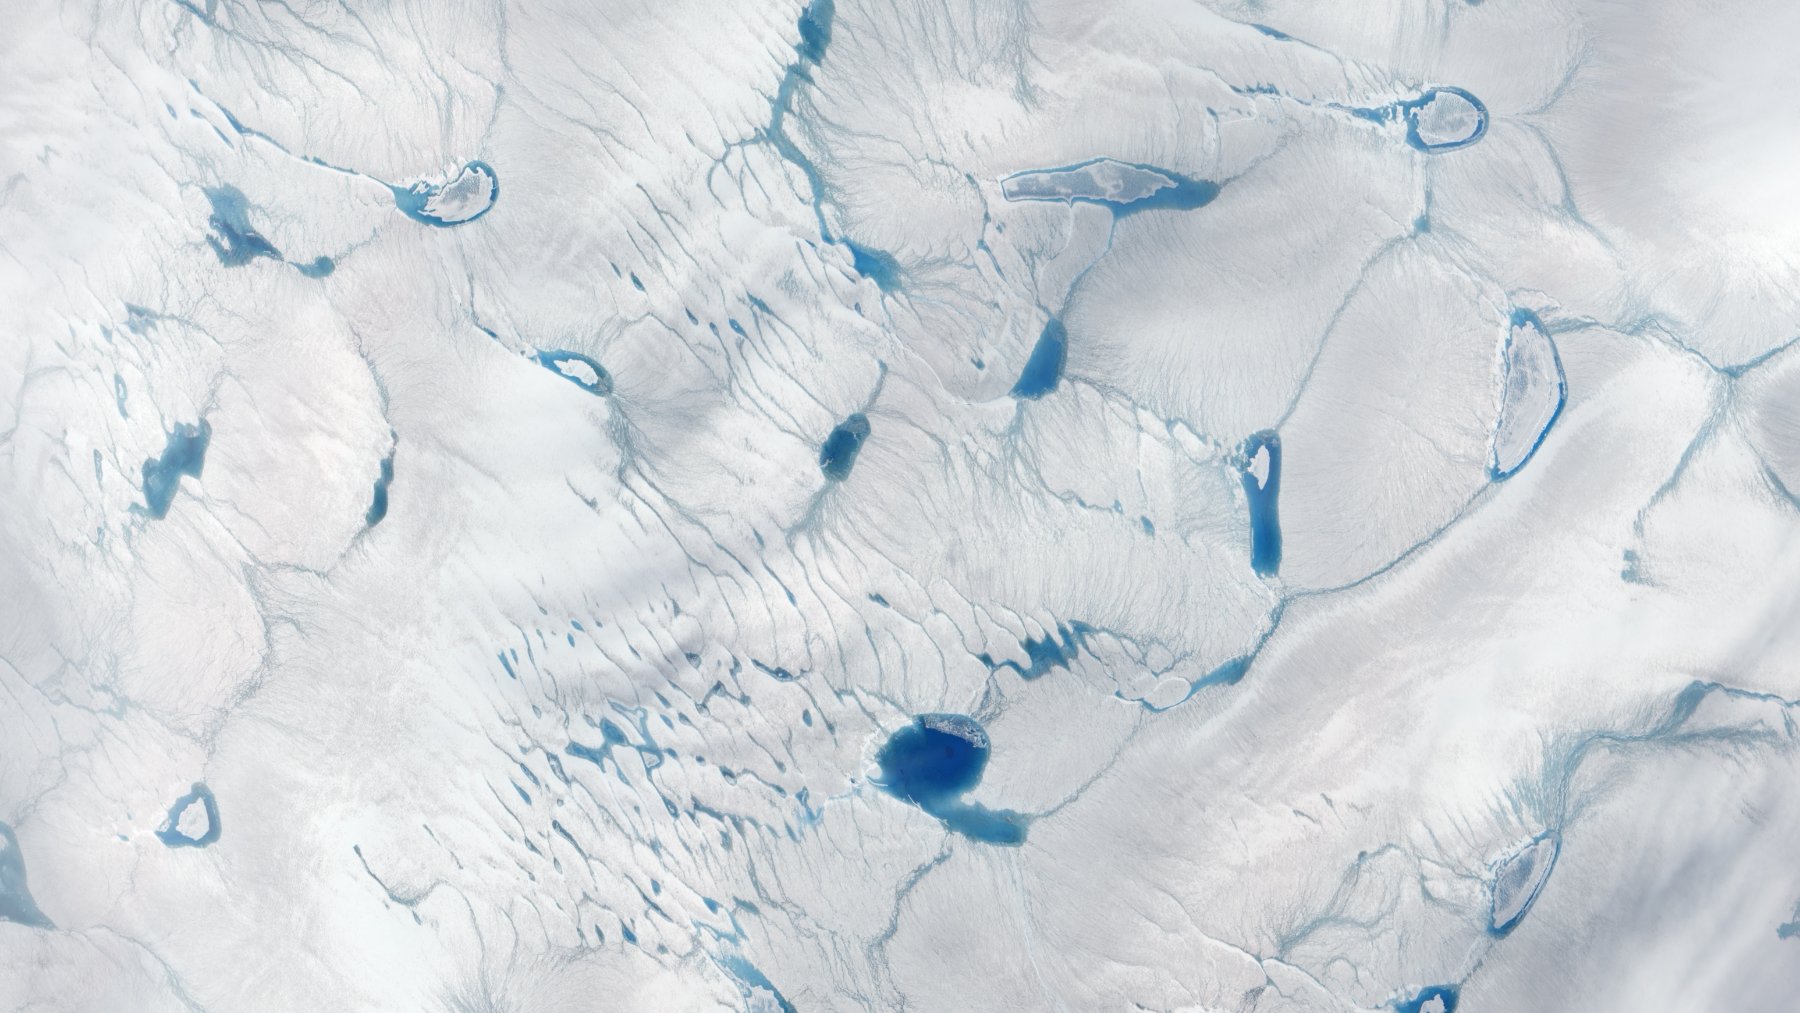
Greenland lost an estimated 105 billion metric tons of ice during the year ending in August 2025, according to Danish climate scientists. Meanwhile, satellites captured gray patches along its southwestern edge, where darker surfaces absorb more sunlight and can accelerate summer melting.
This was not Greenland’s worst melt season. But even a comparatively moderate summer left the ice sheet smaller, while showing how melting and surface darkening can reinforce each other. A quieter year is not the same thing as a recovery.
What the 105-billion-ton figure actually measures
The estimate covers September 1, 2024, through August 31, 2025. Writing in Carbon Brief, Danish Meteorological Institute scientists Martin Stendel and Ruth Mottram calculated the balance between ice gains and losses across the surface, coastal margins, and base. Their assessment marked Greenland’s 29th consecutive year of net ice loss.
Their surface-only calculation showed a gain of about 404 billion metric tons, reflecting snow accumulation after surface losses were accounted for. But that was not the final balance, because iceberg calving, melting where glaciers meet seawater, and smaller losses from the base also had to be included.
Independent satellite measurements offer another way to check the picture. NOAA’s 2025 Arctic Report Card put the loss at 129 billion metric tons, with an uncertainty of plus or minus 50 billion. The assessments give different totals, but both show continued loss.
Why the ice turned gray
NASA’s Landsat 9 images from August 21, 2025, showed extensive dirty-looking ice roughly 90 miles northeast of Nuuk. As snow and ice melted, particles such as black carbon and dust remained behind, darkening the exposed surface. Blue meltwater ponds dotted the same landscape.
Why does the color matter? Scientists call reflectivity “albedo,” and darker ice absorbs more solar energy than bright snow, much as dark pavement warms in sunshine. That extra energy can drive further melting, exposing more dark material and reinforcing the cycle.
A moderate season can still have sharp spikes
The National Snow and Ice Data Center tracked an extended melting episode from roughly July 7 to July 20. By July 20, cumulative melt-day area was above the 1981 to 2010 average, although the season ranked 16th in its 47-year record at that point. Satellite data gaps complicated the assessment.
In mid-August, warm fronts brought another burst of rain and melting to southern Greenland. On August 21, the center reported surface melting across more than 210,000 square miles, a record for that calendar date. A daily record, though, is not the same as a record-setting year of total ice loss.
How distant wildfires enter the picture
NOAA reported that Greenland’s reflectivity fell below average in late August, around the time smoke from North American wildfires appeared along its western coast. Smoke particles deposited on snow or ice can darken the surface and enhance melting.
But smoke overhead is not, by itself, proof of how much soot settled onto the ice. The report identifies a possible connection rather than quantifying how much of Greenland’s 2025 ice loss was caused by those fires.
Fresh snow can change the picture
By September 6, 2025, fresh snow appeared to cover much of the gray ice in NASA’s comparison images. The National Snow and Ice Data Center also reported that a thin snow covering had temporarily brightened the surface and suppressed melting during August. The feedback is powerful, but its strength changes with conditions.
That does not mean a snowfall replaces the ice lost over decades. It means a surface can become more reflective again even while the ice sheet’s annual balance remains negative. A white satellite image and a recovering ice sheet are not interchangeable.
What the longer record tells us
A separate study published in February 2026 examined extreme Greenland melting from 1950 through 2023, rather than the 2025 season. Its authors described events becoming “more frequent, extensive, and severe,” with seven of the ten most extreme events occurring after 2000.
Researchers compared episodes with similar atmospheric circulation patterns to investigate why melting had intensified. Their findings point to the warming background climate as an important influence, not simply the arrival of a particular weather pattern. That helps explain why one moderate summer cannot settle questions about Greenland’s long-term stability.
For communities far from Greenland, continued land-ice loss matters because it contributes to rising seas and coastal flooding risks.
The study on extreme melt events was published in Nature Communications on February 11, 2026.