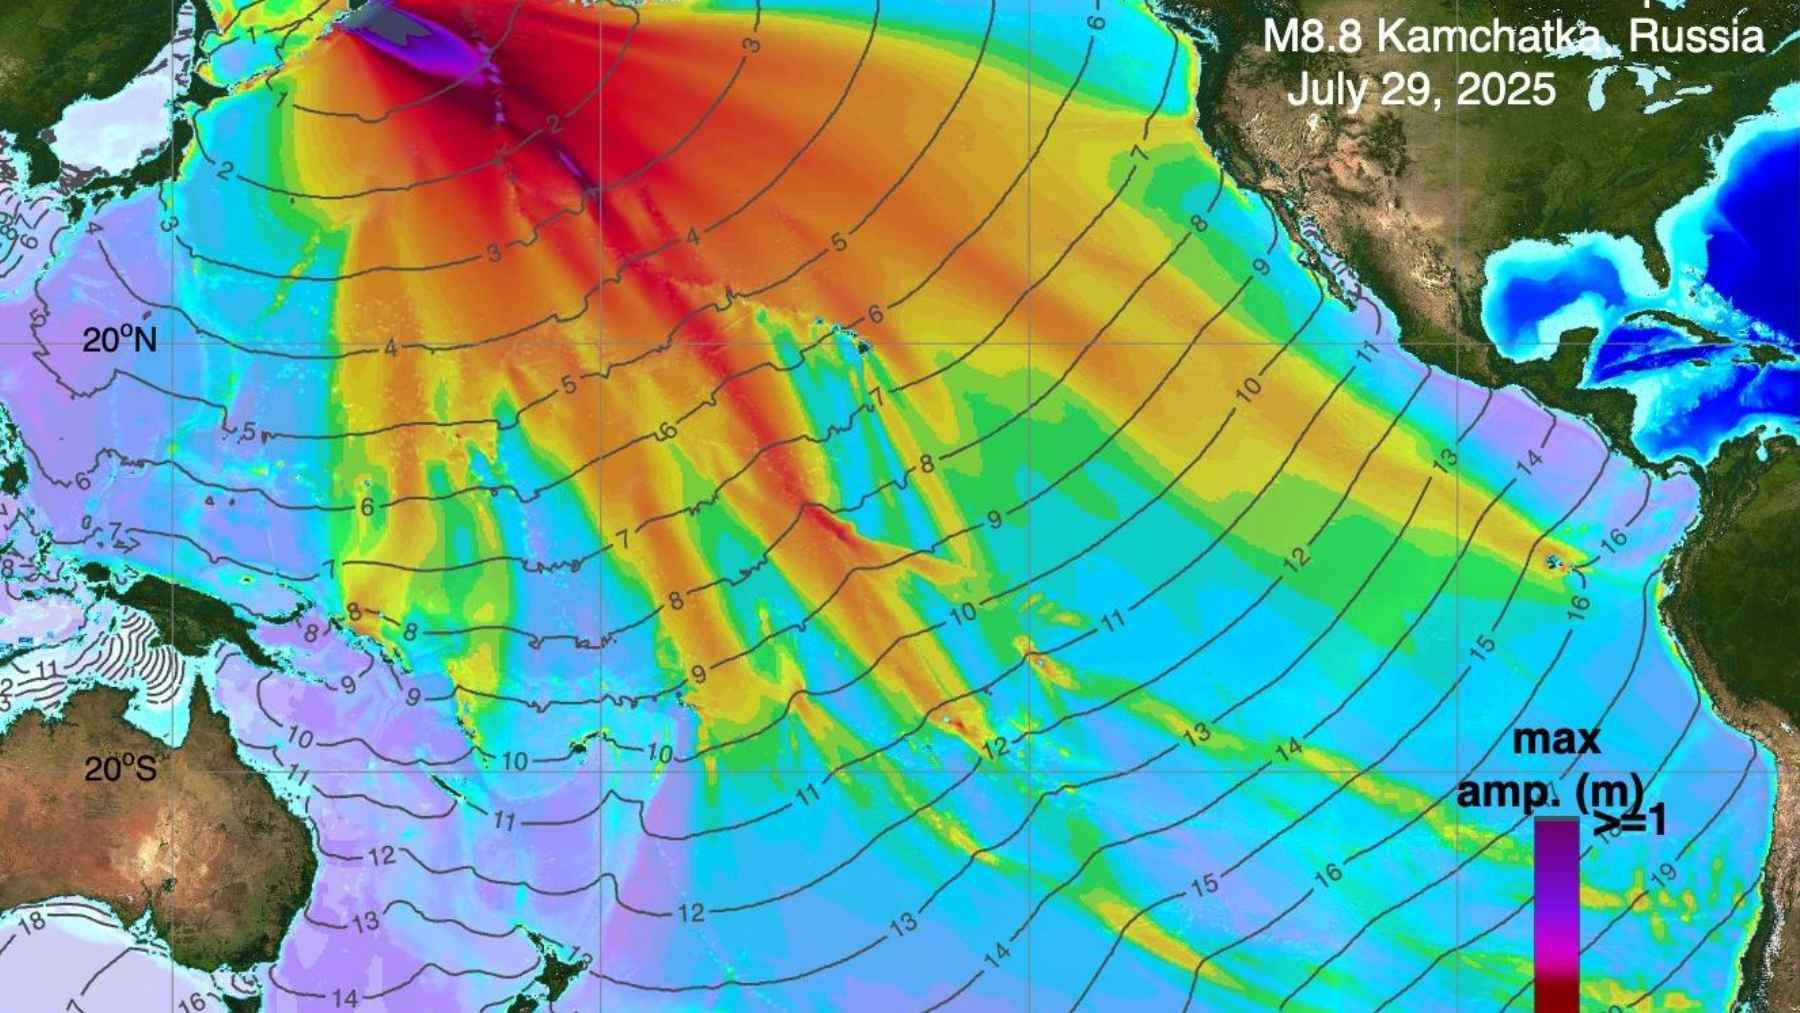
The magnitude 8.8 earthquake that struck offshore Kamchatka on July 29, 2025, was not just another strong quake on a dangerous fault. Official analyses describe it as one of the largest earthquakes recorded by modern instruments, and it generated atsunami observed across the Pacific Basin.
Now a new 64-page preprint argues that part of the warning story may have been hidden in very small earthquakes that standard processing did not locate. The study, led by I. O. Kitov, says a method called waveform cross-correlation recovered a rising pattern of low-magnitude seismicity before the main shock.
Tiny signals before a giant quake
The basic idea is simple. Instead of waiting for a quake signal to stand out clearly, waveform cross-correlation compares new seismic wiggles with known earthquake patterns, almost like identifying a familiar voice in a crowded room.
According to the paper, that approach can lower the detection threshold by about a factor of ten compared with beamforming, a standard way of combining data from array stations. That matters because weak events can carry clues about how stress is moving underground before a bigger break.
Why Kamchatka matters
Kamchatka sits along a subduction zone, a place where one tectonic plate slowly dives beneath another. There, the Pacific plate moves northwest and slips beneath the Okhotsk microplate at about 3.1 inches per year.
That movement does not happen smoothly every day. Stress can build for decades, then release in minutes, shaking cities, damaging coastlines, and sending waves across the ocean. That is why even small improvements in reading the fault’s behavior can matter.
What the new study found
The study focuses on events listed in a cross-correlation bulletin, called XSEL, that were below the detection level of the International Data Centre. In practical terms, that means the same stream of seismic data contained information than the regular pipeline would have otherwise ignored.
The key finding is the shape of the buildup. As the earthquake approached, the low-level activity reportedly became more intense and included events of growing magnitude, marking the transition into the main rupture.
Could this have been a usable public warning? Not yet. The study is best read as evidence that small quakes may reveal a preparation process, not as proof that any single future earthquake can now be predicted on demand.
How the method works
Seismic arrays are groups of sensors spread across an area, not just one instrument in the ground. The Comprehensive Nuclear-Test-Ban Treaty Organization says the International Monitoring System uses primary and auxiliary seismic stations, and array stations help separate useful signals from background noise.
Waveform cross-correlation adds another filter. It looks for similarities between a new signal and a “master event,” meaning a previously recorded earthquake from a nearby source area. If the match is strong, scientists can weed out weak events that otherwise characterise the inconsequential rumblings of the planet.
A clue from an earlier earthquake
The Kamchatka work builds on a comparison with the Sea of Okhotsk earthquake of May 24, 2013, which had a magnitude of 8.3. In that case, the same kind of processing reportedly detected the beginning and growth of intense low-magnitude seismicity during the five days before the main shock.
A related January 2026 paper by the same author also examined the days between the July 20, 2025, magnitude 7.4 earthquake and the July 29 main shock. That earlier work found smaller events in areas where the standard reviewed bulletin had no located sources, opening a more detailed view of the run-up.

The Kamchatka Peninsula is one of Earth’s most active seismic regions, where researchers are studying earthquake precursors before major events.
Why this is not a crystal ball
Earthquake prediction is a loaded phrase. People want a date, a place, and a size, the kind of warning that lets schools close and coastal families get out before traffic jams and sirens begin. This study does not offer that kind of ready-made alert.
What it does offer is a possible way to watch the quiet part of a fault more closely. For the most part, it points toward better research tools, not an app that can tell someone when the ground will move under their feet.
What official studies add
A U.S. Geological Survey team led by Harriet Zoe Yin described the Kamchatka event as difficult to characterize quickly because public near-source data were sparse at the time. Their analysis also linked the rupture to the same broad fault system that produced the huge 1952 Kamchatka earthquake.
NOAA’s tsunami research page reported more than 100 aftershocks of magnitude 5 or larger in the first two days after the main shock. Its model placed the early aftershock zone across an area about 310 miles long and more than 93 miles wide, a reminder of how large the rupture became.
What comes next
The most useful question now is whether the pattern repeats. If similar low-magnitude buildups appear before other very large earthquakes, scientists may gain a better way to tell routine aftershocks from a system moving toward a much bigger break.
That will take more testing, more regions, and careful comparisons with cases where no major earthquake followed. At the end of the day, a method that finds more tiny quakes is only useful for warning if it can also avoid too many false alarms.
For coastal communities, though, the promise is hard to ignore. A better read on the underground buildup could one day support faster hazard decisions, especially in places where a few minutes can change how people respond to a tsunami threat.
The main study has been posted on arXiv.