For most people, sea level rise brings one image to mind, huge chunks of ice breaking away from Greenland or Antarctica. That picture is not wrong, but a new analysis suggests the biggest driver since 1960 has been something harder to see. The ocean itself is swelling as it warms.
An international team led by Huayi Zheng and Lijing Cheng at the Institute of Atmospheric Physics, Chinese Academy of Sciences, reanalyzed decades of ocean records. Their work found that global sea level rise is accelerating, and that heat stored in seawater explains the largest share of the increase.
The ocean is swelling
The key idea is called thermal expansion. Put simply, warmer water takes up more room than cooler water, so the ocean can rise even before a single extra drop from melting ice is added.
NASA explains that more than 90 percent of the extra heat trapped by greenhouse gases is absorbed by the ocean. As that heat builds up, ocean temperatures rise, the water expands, and global sea level climbs.
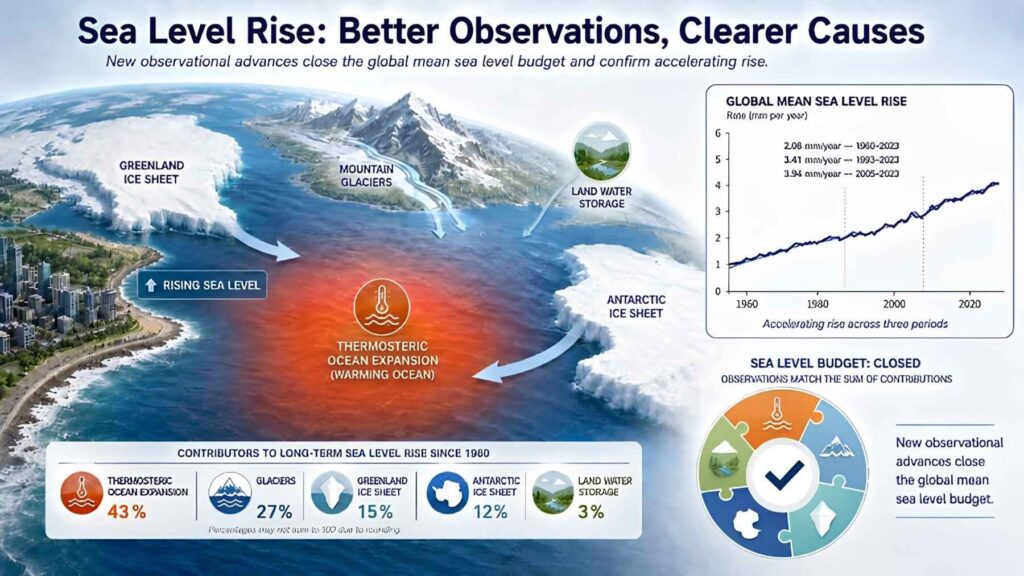
The new study estimates that thermal expansion caused 43 percent of global mean sea level rise from 1960 to 2023. Mountain glaciers contributed 27 percent, Greenland’s ice sheet 15 percent, Antarctica’s ice sheet 12 percent, and changes in water stored on land another 3 percent.
Why this changes the story
For years, the public conversation has focused mostly on ice. That makes sense, because melting glaciers are visible, dramatic, and easy to understand. But heat hidden inside seawater works quietly, all across the planet.
Scientists often describe this as the global sea level budget. Think of it like balancing a checkbook. The rise measured by tide gauges and satellites should match the combined causes behind it.
For a long time, the numbers did not fully line up. John Abraham, a coauthor at the University of St. Thomas, said the new work shows that researchers can now explain sea level rise “with greater confidence.”
The rise is speeding up
From 1960 to 2023, global mean sea level rose by about 0.08 inches per year on average. From 1993 to 2023, the rate climbed to about 0.13 inches per year. From 2005 to 2023, it reached about 0.16 inches per year.
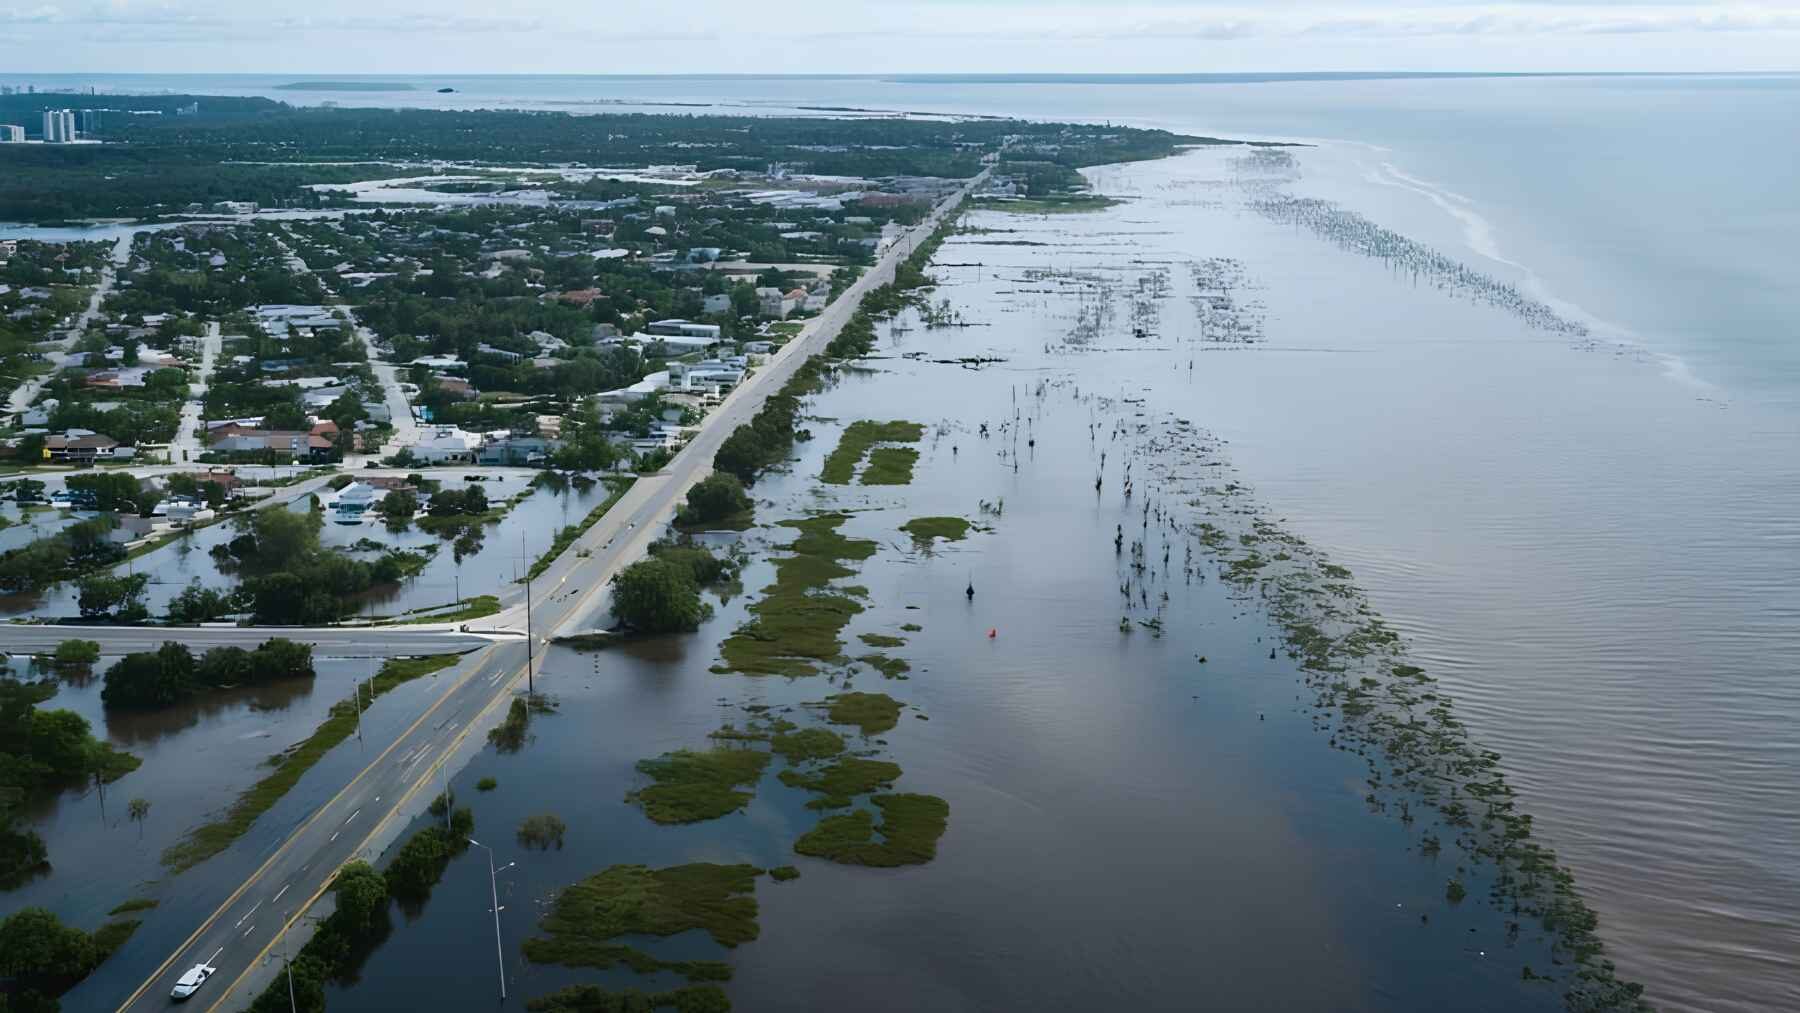
Those numbers may sound tiny, almost harmless. But year after year, they stack up, especially during storms, king tides, and heavy rain events when streets, drains, and seawalls are already under pressure.
NOAA warns that higher seas allow storm surges to push farther inland and make nuisance flooding more frequent. In the United States, nearly 40 percent of the population lives in relatively dense coastal areas, where sea level affects flooding, erosion, and storm hazards.
Ice still matters
None of this means melting ice is off the hook. Far from it. Glaciers and the Greenland and Antarctic ice sheets still explain most of the remaining rise in the study’s breakdown.
There is also an important difference between floating sea ice and land ice. Floating ice is already in the ocean, like ice in a glass of water, but land ice adds new water when it melts and flows into the sea.
That is why the picture is not an either or story. Warming air and warming water can both drive ice loss, while the ocean also expands as it absorbs heat. The same heat is pulling more than one lever at once.
Better measurements helped
The researchers used several kinds of records to sharpen the picture. These included tide gauges along coasts, satellite measurements from space, and ocean monitoring floats that track changes below the surface.
The team also accounted for technical problems that can blur the signal. These include subtle satellite measurement shifts, land movement near tide gauges, and updated estimates of ice loss from Greenland and Antarctica.
In practical terms, the study says the sea level budget now closes much more tightly than before. The leftover gap between measured rise and known causes is now smaller than one hundredth of an inch per year across the periods analyzed.
What it means for coasts
For coastal cities, the finding matters because it improves the math behind future planning. Roads, bridges, water systems, subways, power plants, sewage treatment sites, and homes all become more vulnerable as the baseline ocean level rises.
Anyone who has seen saltwater creeping over a street during a sunny day flood knows this is not just about faraway ice. It is about traffic jams, damaged cars, closed businesses, and the slow stress of living with water where it did not used to be.
There is nuance, too. Sea level does not rise by the same amount everywhere, because local land sinking, groundwater withdrawal, ocean currents, and other regional factors can make the local impact higher or lower than the global average.
The bigger picture
At the end of the day, the study does not replace the familiar story about melting ice. It widens it. Rising seas are being driven by ice loss, but also by the basic physics of warmer water taking up more space.
That makes ocean heat a central part of the sea level story. The trouble is, oceans respond slowly, so the effects can continue long after the original heat enters the system.
The main study has been published in Science Advances.