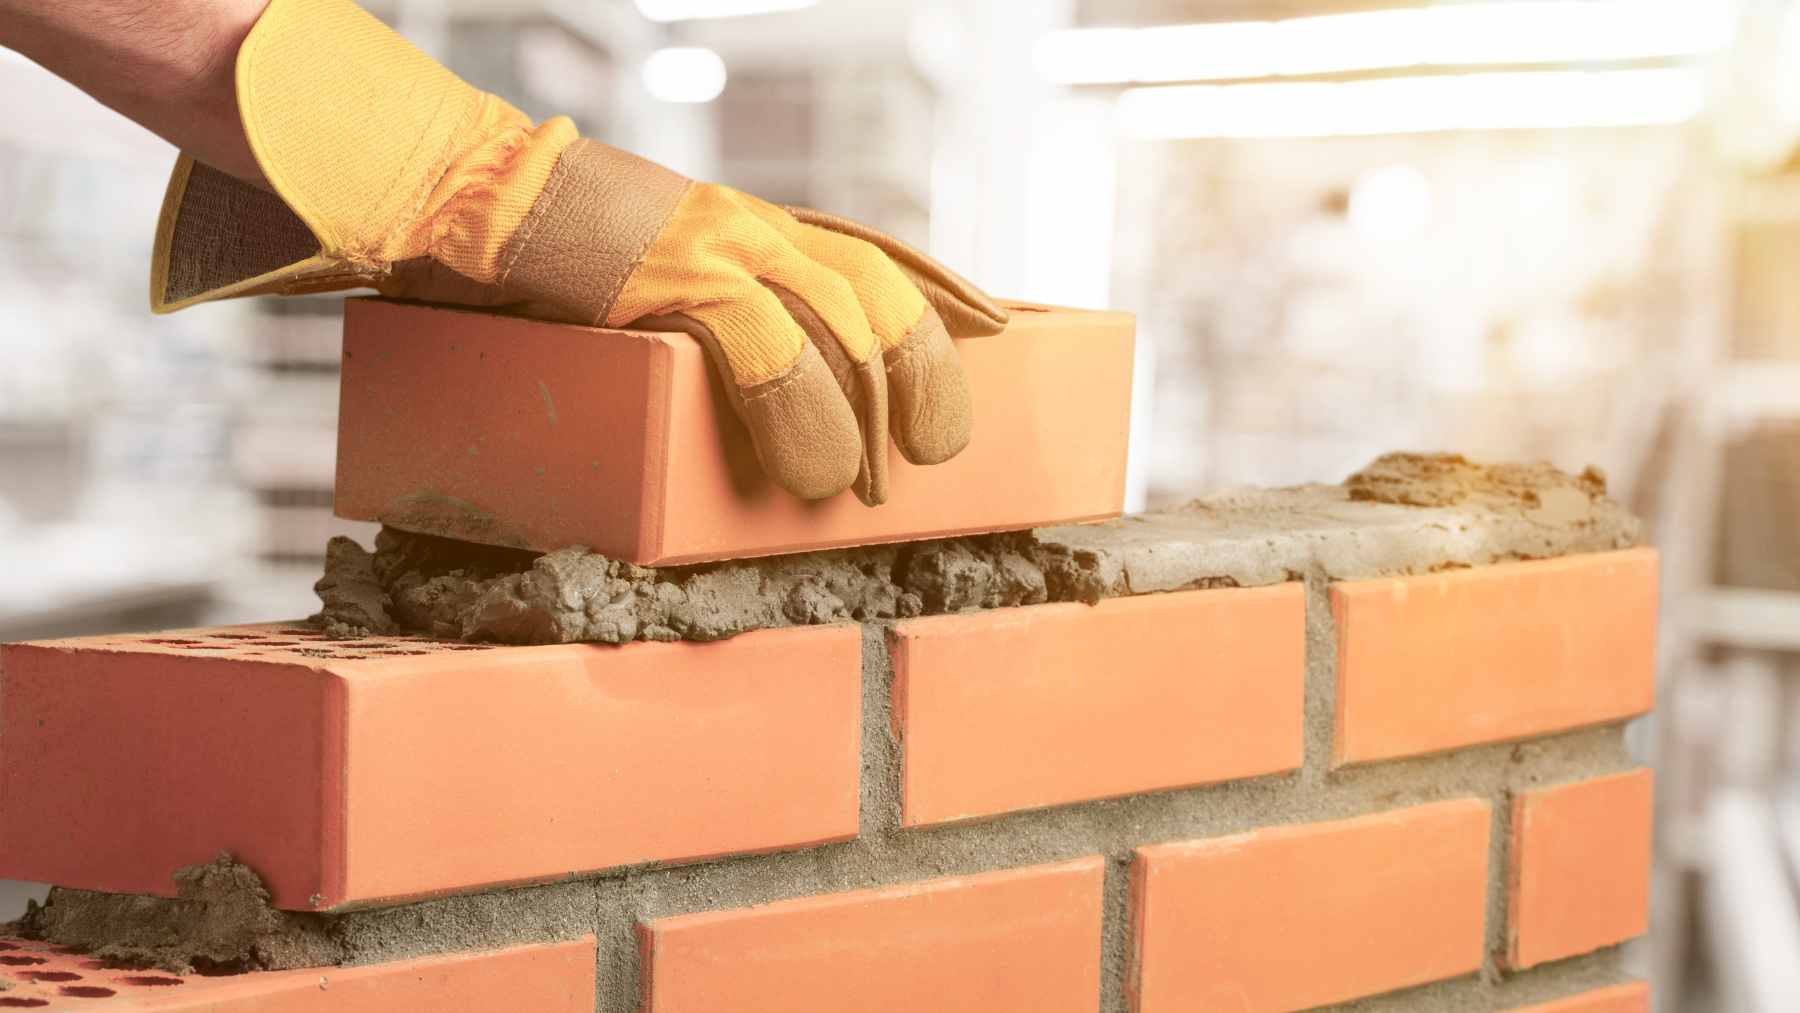
The construction sector is not only looking for new materials to ensure thermal insulation, but it is also considering rethinking those that we have been using for decades… or even experimenting with those we would have never imagined. If we were surprised by houses built with LEGO bricks, we will be even more amazed by this insulation that you have been throwing away for years.
The best insulation in construction: cheap, rudimentary, and discarded
Newspaper is one of the best insulation materials for construction. Although it may seem surprising, stacked newspaper sheets have excellent properties for blocking heat transfer.
This ancient waste material has proven to be more effective than many modern insulators. In fact, there are currently only a few companies in our country that work with it in a manner praised by the sector. These are the kinds of initiatives that excite us the most.
By using recycled newspaper as insulation, not only do we obtain a very efficient construction material, but we also reuse resources that would otherwise be wasted. Newspaper insulation represents a sustainable and economical solution for improving thermal insulation.
Newspaper insulation, a new construction insulator? It has everything we need
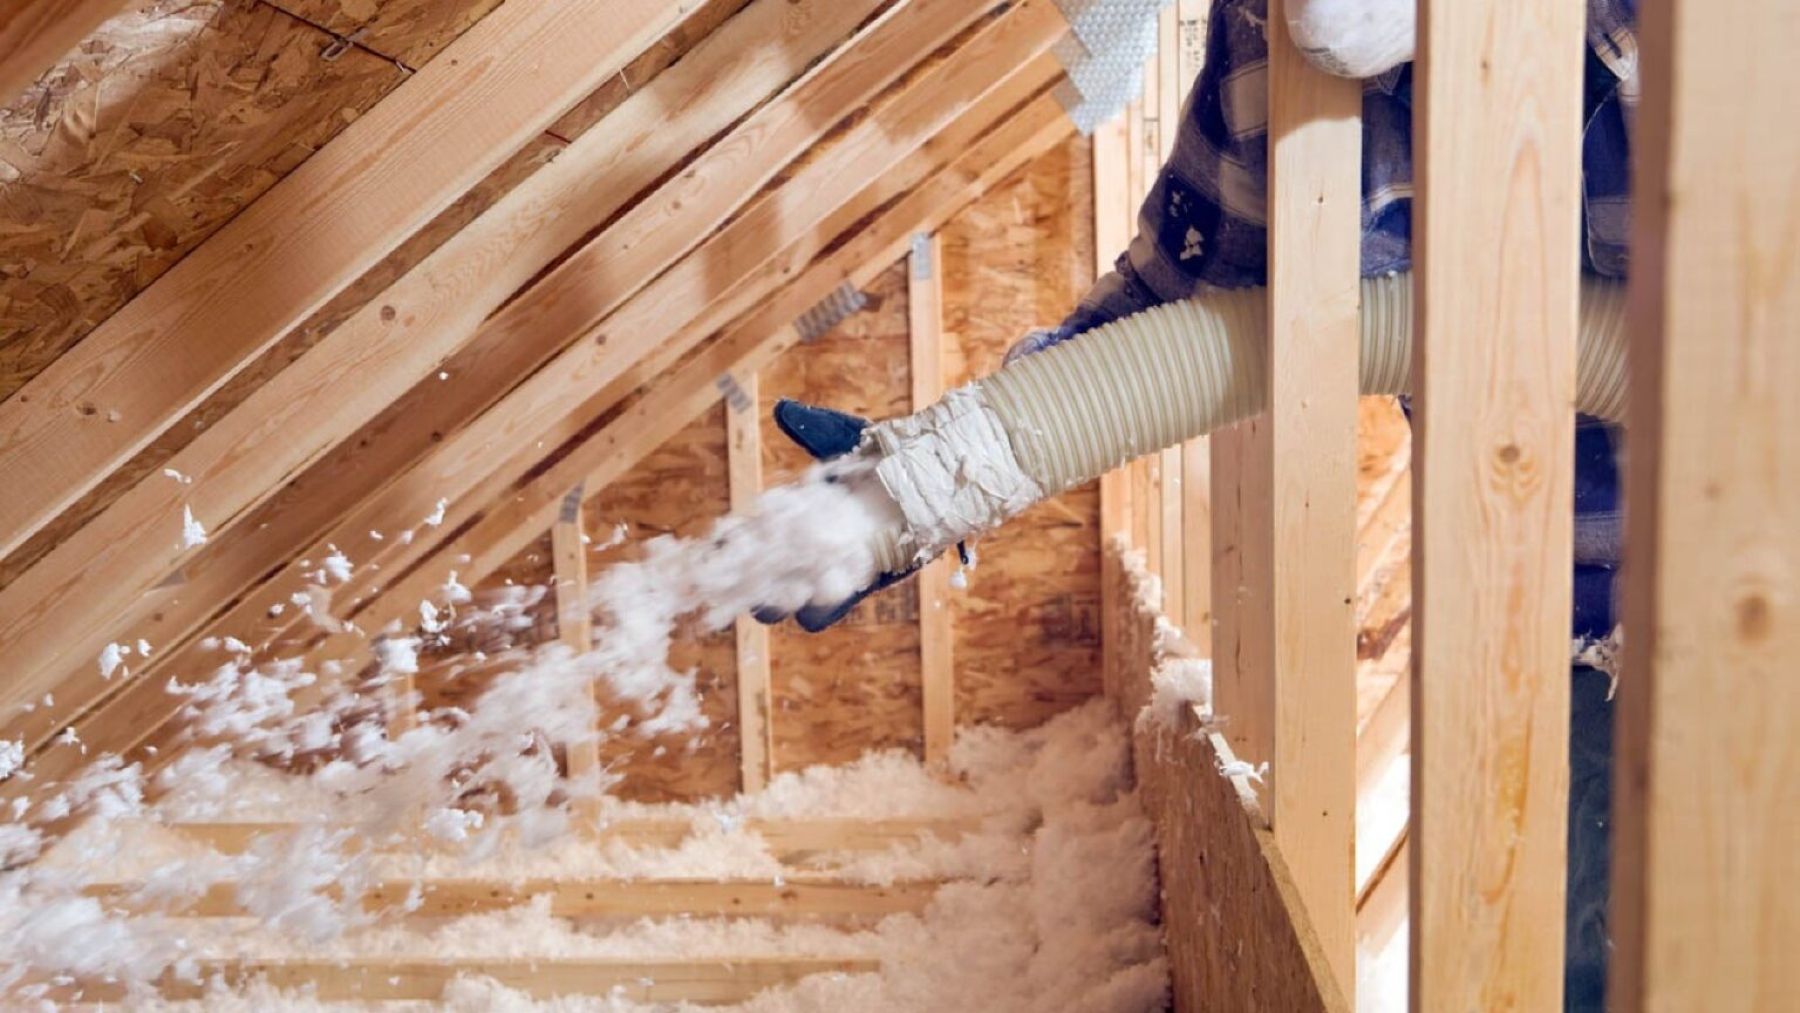
Newspaper insulation is made from recycled paper, mainly old newspapers that are shredded and transformed into insulating material. Unlike traditional fiberglass or foam insulation, newspaper insulation is highly breathable and allows moisture to pass through while still providing insulation.
Paper fibers absorb and retain moisture, helping regulate moisture levels and preventing condensation. At the same time, the air pockets between the shredded paper fibers act as insulation and slow down heat transfer.
One of the biggest advantages of newspaper insulation is its light and fluffy texture. It is much less dense than other types of insulation, making it easier to transport and install. The fluffy newspaper fibers easily conform around pipes, studs, and other building materials.
The minimal environmental impact of the newspaper: its main advantage
Using newspaper as insulation has several environmental advantages. By reusing old newspapers that would otherwise be discarded, landfill waste is avoided. On average, a person generates over 150 kilograms of paper waste per year, much of which is newspapers.
Recycling this paper to convert it into insulation gives it a new life and reduces the need for additional materials. Newspaper insulation is manufactured entirely from recycled content, so it does not require new resources.
In contrast, traditional fiberglass insulation consumes a lot of energy and raw materials during its production. Sourcing recycled newspaper consumes much less energy than extracting and processing virgin materials. This reduces the overall carbon footprint of insulation materials.
At a time when sustainability is increasingly important for construction, newspaper insulation offers an ecological solution. Builders can feel good knowing that they are diverting waste while reducing their dependence on new materials.
As you can see, this construction insulation is an opportunity to improve thermal efficiency at home. However, it is not the only material that is becoming popular; we have also seen a new transparent wood that is 10 times stronger than glass and plastic (and, of course, 100% renewable and sustainable).