Extreme lightning days over northern Europe came about twice as often during high-speed solar wind, a new study reports. The team examined roughly 9 million flashes recorded from 1998 to 2019. On fast solar wind days, 19.5 percent were extreme lightning days, compared with 9.9 percent of other days.
Marzieh Khansari, a researcher at the University of Oulu’s Sodankylä Geophysical Observatory, led the work. Her paper came out on September 22, 2026, in Communications Earth & Environment. Two of her three co-authors work at the Institute of Atmospheric Physics in Prague.
Nine million flashes from NORDLIS
Finland’s weather service, the Finnish Meteorological Institute, supplied the flashes through its Nordic Lightning Information System, known as NORDLIS. Its study area ran from 60 to 71 degrees north. That box covers Finland, Sweden and Norway on both sides of the Arctic Circle.
According to the paper’s methods section, the network began with five sensors in Finland. It had 18 sensors in Finland and Norway by August 2001. In 2002 it grew to 29, now with Sweden on board.
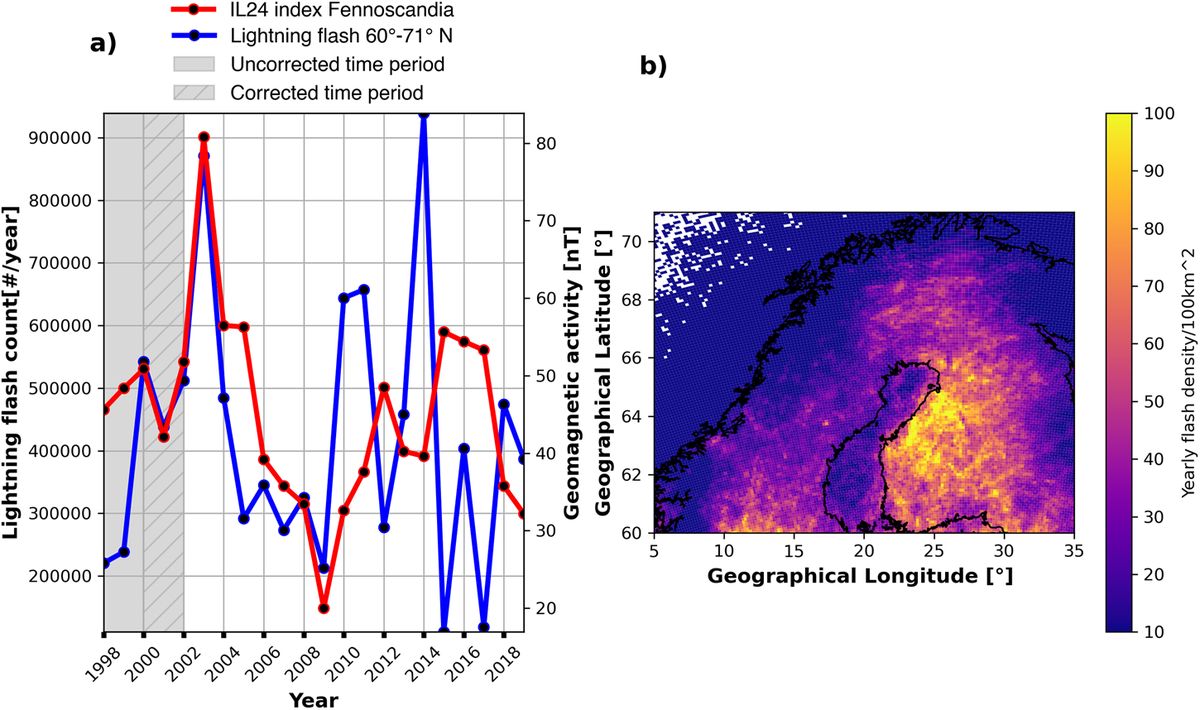
Because the early sensors missed many strikes, the team dropped 1998 and 1999 from its statistics. It also corrected the counts for 2000 and 2001. From 2000 to 2019, the region averaged 25 flashes per 100 square kilometers (about 39 square miles) a year, and parts of Finland topped 100.
Extreme days at 19.5 percent
Solar wind is the flow of charged particles that the sun sends out in every direction. NOAA watches it closely, along with the solar storms its forecasters warn about. Here, a high-speed stream meant wind above 750 kilometers per second (about 466 miles per second) for more than six hours.
An extreme lightning day was any day above the 90th percentile of daily flash counts. In other words, it was one of the busiest tenth of days. From 2000 to 2019, 77 days met the high-speed definition, spread fairly evenly across the seasons.
On those days, the region averaged 3,215 flashes, against 1,175 on other days. Statistically, that gap in averages was real but small, the authors say. For extreme days, they found an odds ratio of 2.20, which means the odds more than doubled.
The jump was significant only in some latitude bands, among them 62 to 64 degrees north and 65 to 66 degrees north. The largest odds ratio, 2.53, came from 69 to 70 degrees north. Tromsø, in northern Norway, sits at that latitude.
Cloud cover at 65 degrees north
Weather comes first, and in the paper’s own words, thunderstorm formation “requires moisture, atmospheric instability, and a lifting mechanism.” So the researchers ran the test again over Finland. This time they kept only days with cloud cover of at least 5 on the 0 to 8 scale.
Once the clearer days were gone, the strongest result came from 65 to 66 degrees north, between Oulu and Rovaniemi. There, 20.5 percent of high-speed days were extreme lightning days. On other days the share was 7.9 percent, an odds ratio of 3.01.
According to the authors, ignoring clouds may explain why older studies of total flash counts disagreed. “Studies that do not account for cloud conditions will likely underestimate any detectable solar wind effect,” they write.
The outsized weight of 2003
The team also compared whole years across solar cycle 23, which in this analysis ran from 2000 to 2008. Lightning, geomagnetic activity and fast solar wind all peaked in 2003. Proton readings from POES satellites, about 500 miles (800 kilometers) up, tracked yearly lightning with a correlation of 0.80.
Right around the Arctic Circle, between 66 and 67 degrees north, protons of 250 to 800 kiloelectronvolts gave a correlation of 0.93, the highest in the paper. Without 2003, it barely moved, slipping to 0.92.
Other results, especially those tied to high-speed streams, weakened sharply once 2003 was removed. The yearly link between fast solar wind and lightning then held only from 65 to 66 degrees north.
At daily, weekly and monthly scales, most correlations turned weak or vanished. The authors call the influence “strictly constrained by local meteorological conditions.” It “surprisingly, emerges only on long timescales,” they add.
Pathways from orbit to cloud
The paper weighs three possible routes from space to storm. In the first, energetic particles add free electrons that help trigger a flash, a process called runaway breakdown. That should happen within hours, so the weak short-term signal makes it an unlikely main driver.
A second route runs through the global atmospheric electric circuit, which links the ground with the upper atmosphere. Particles could change how well the air conducts. Storms and the upper sky do trade electrical energy, as red sprites photographed from the space station show.
If that second mechanism is at work, the authors write, “its effect on lightning builds up slowly over time.” A third route involves the east-west, or By, part of the interplanetary magnetic field. That signal, too, traced back mostly to 2003.
Forecast value still unproven
The study tracks statistical links, and its authors say the results do not point to a single mechanism. When they lined up 55 high-speed stream events, they found no sharp lightning peak on arrival day.
Lightning instead ran high for days on either side, peaking on average 11 days before onset. That pattern also leaned on 2003. The sensor network changed over time, and the analysis used only cloud-to-ground flashes.
Forecasters today work with probabilities from observations and weather models. NOAA’s National Severe Storms Laboratory says single strikes cannot be predicted. Whether solar wind data could sharpen those odds has not been tested.
The study did not count fires either. A 2017 NASA-funded study tied lightning storms to major fire years in Alaska and northern Canada. Those northern lands also hold large Arctic carbon stores.
The full study was published in Communications Earth & Environment.
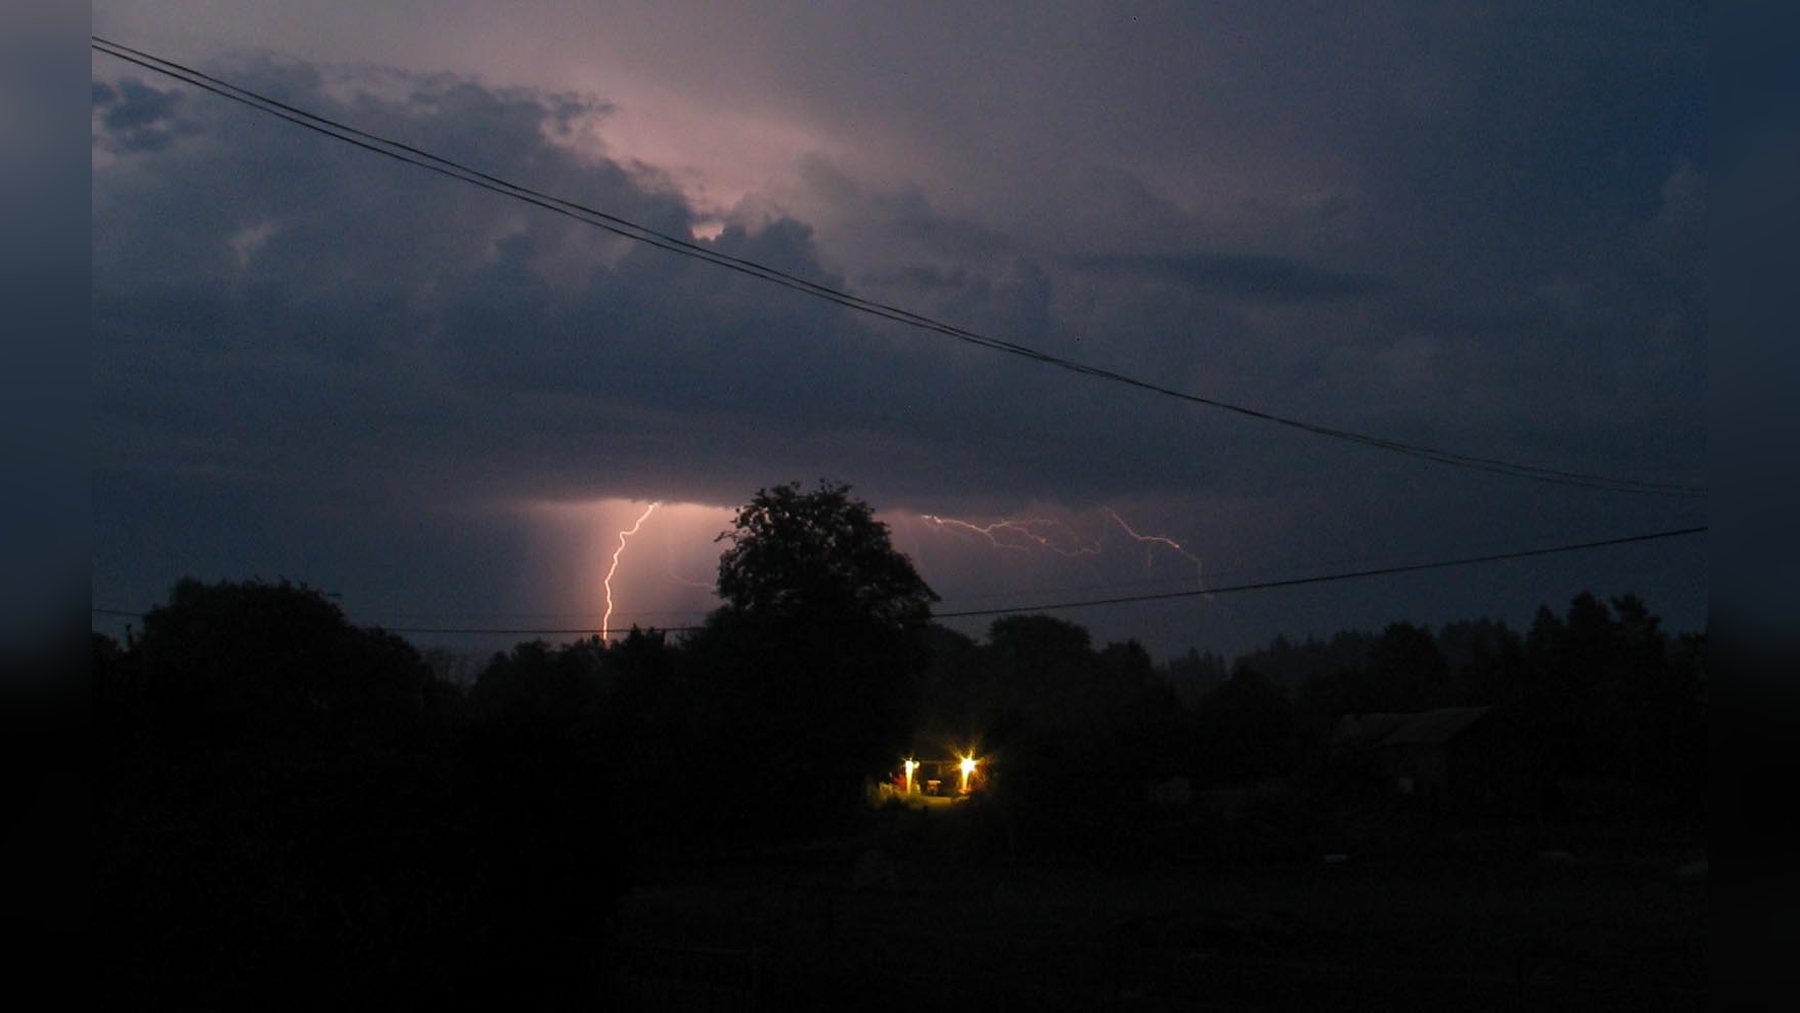
Photo: Jonas Bergsten / Wikimedia Commons (public domain)