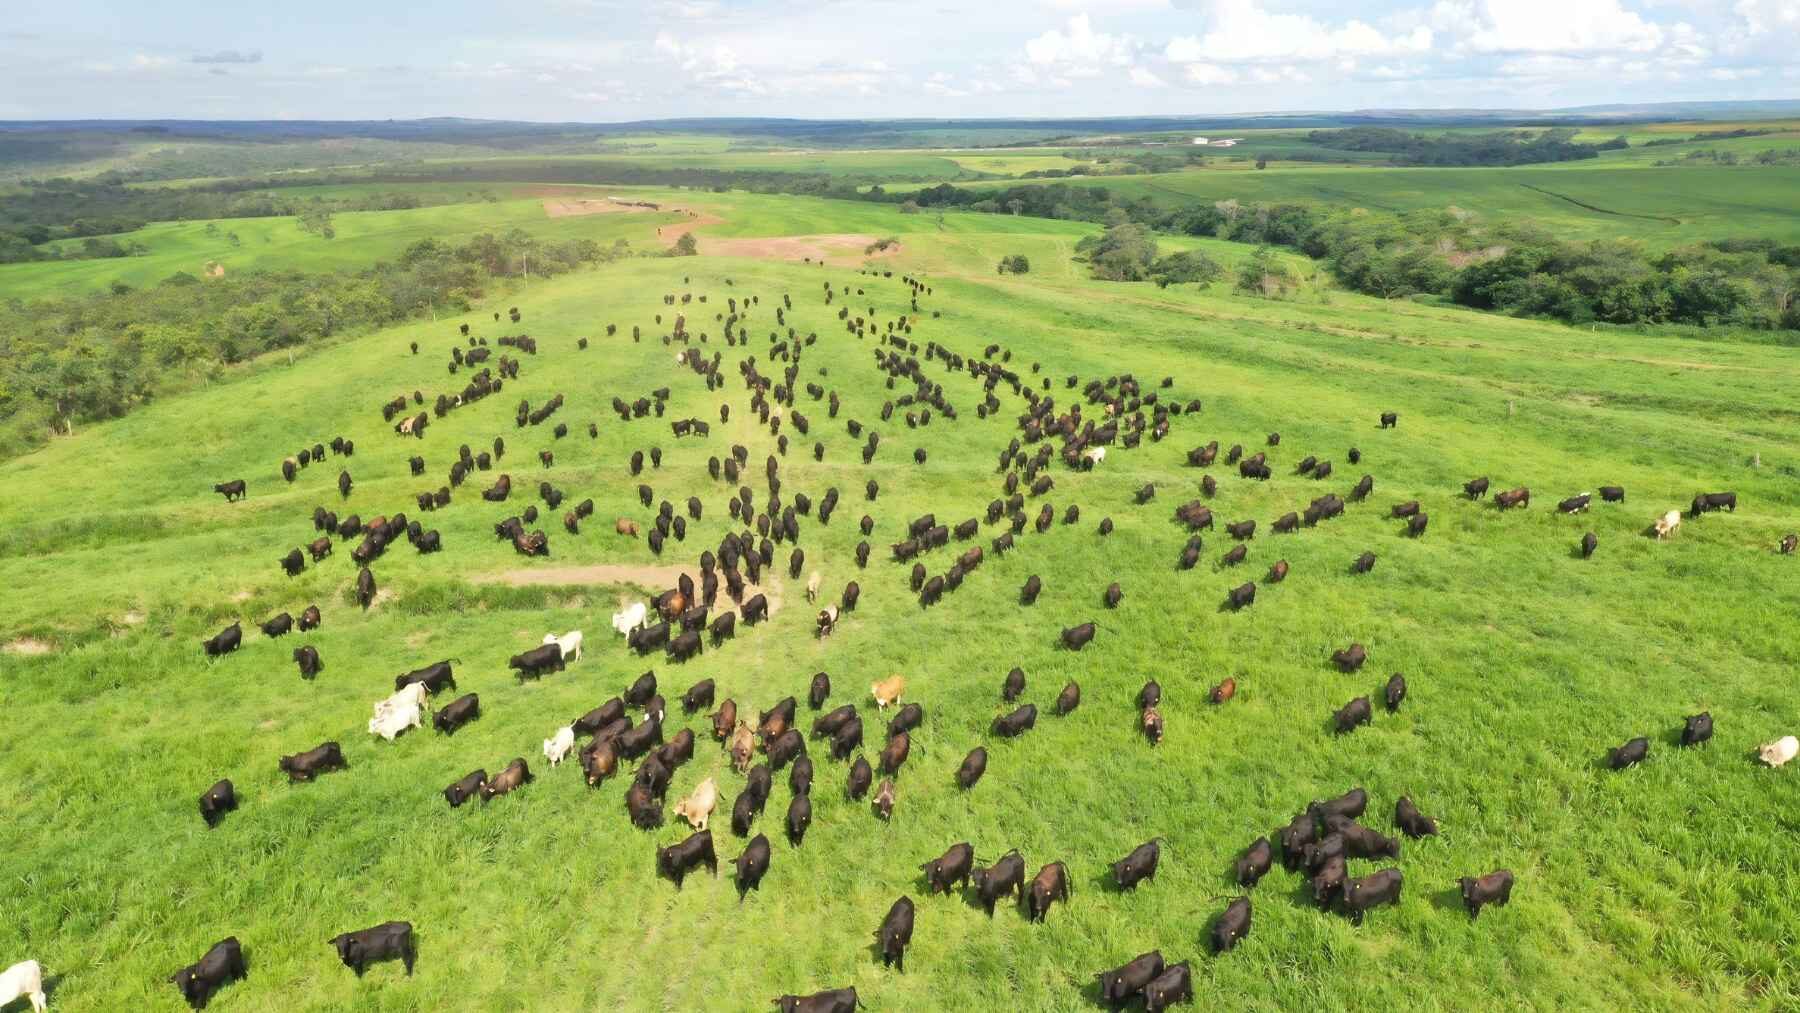
Not every acre of farmland carries the same environmental cost. Far from it. A new global mapping study finds that roughly one-third of agricultural land is linked to about two-thirds of the long-term carbon storage loss and biodiversity loss associated with farming.
That’s a huge difference. And it matters. The findings suggest that carefully targeting the worst environmental hotspots could deliver much bigger gains than treating every field and pasture as if they caused the same damage.
Damage is concentrated
So, where is the damage happening? The largest combined hotspots appear in Mexico and Central America, parts of Brazil, West Africa, India, China, and Southeast Asia. Many are places where intensive agriculture overlaps with ecosystems that naturally hold large amounts of carbon and support plenty of species.
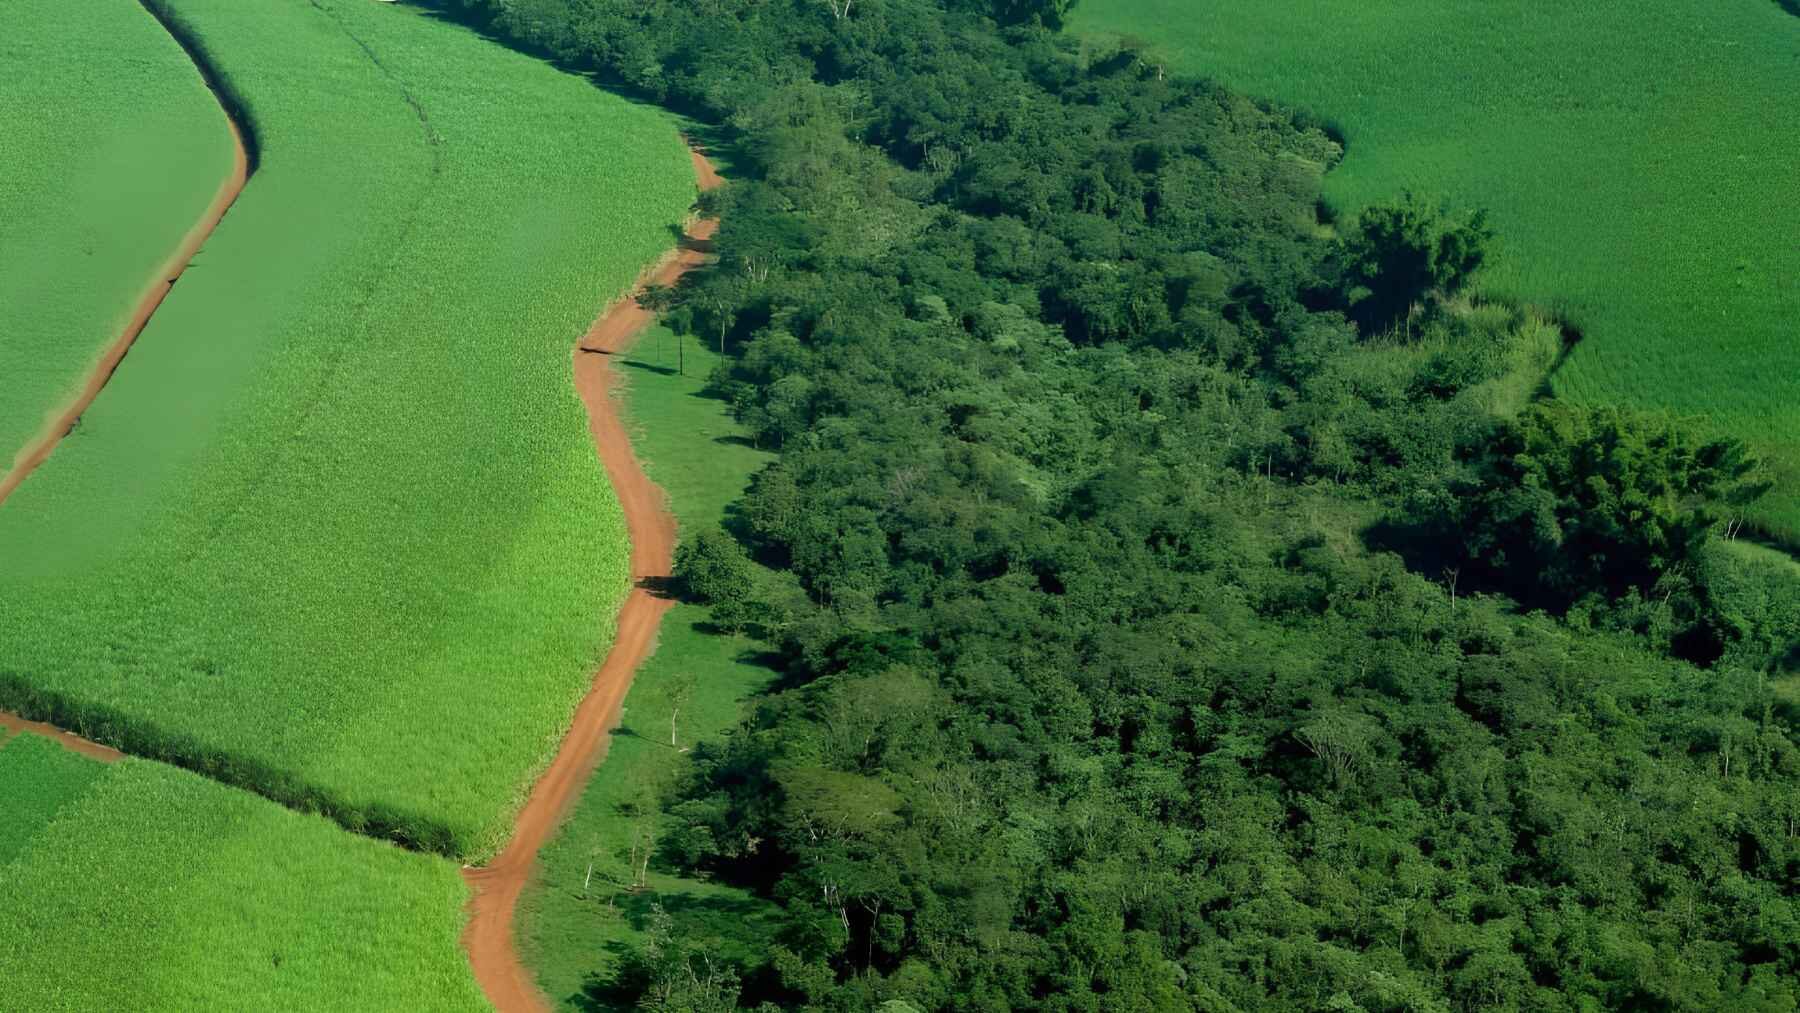
Forests, grasslands, and soils work a little like natural carbon banks. They store carbon that would otherwise end up in the atmosphere. Clear those ecosystems for agriculture, and some of that storage disappears. Biodiversity can fall at the same time as plants and animals lose their habitat. Two problems. Same patch of land.
How the maps were built
The researchers combined global maps of cropland and pasture with estimates of carbon stored in vegetation and soil. They also modeled biodiversity loss based on the ecosystem, the type of land use, and how intensively the land was farmed.
The result was surprisingly detailed. The final global map divided the planet into cells roughly 3.5 miles wide at the equator.
Lead author Baoxiao Liu worked with Paul Behrens, Zhongxiao Sun, and Laura Scherer across Leiden University’s Institute of Environmental Sciences, the University of Oxford’s Oxford Martin School, and China Agricultural University.
The team then connected those maps to global food supply chains. In simple terms, they followed environmental pressure from the farm all the way to the food people eventually eat.
Animal foods have a bigger footprint
And what happens when you follow the food? Food consumption accounted for 83% of the mapped losses. Within that share, animal-sourced foods were responsible for 59% of carbon storage loss and 71% of biodiversity loss. That’s a pretty big footprint.
The researchers found that beef and milk were the largest combined contributors among the foods examined. Together, they accounted for 29% of carbon storage loss and 41% of biodiversity loss linked to food production.
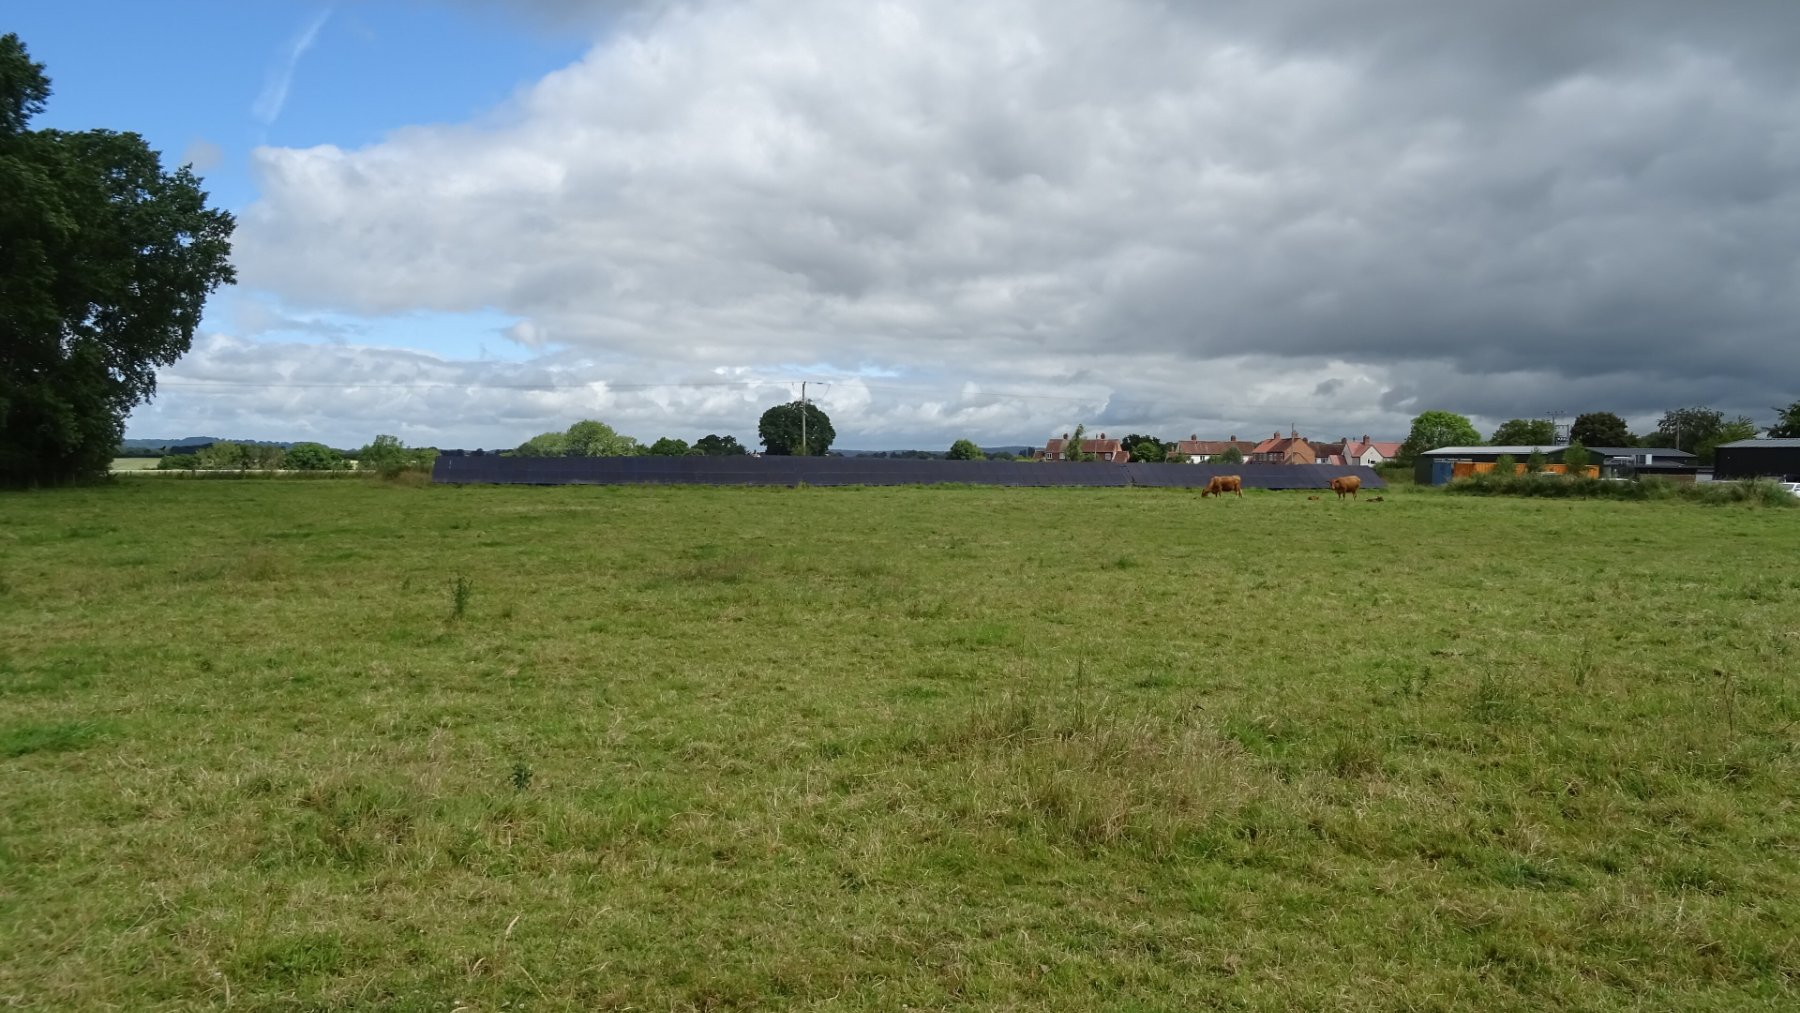
Why so much? Cattle need a lot of land. There is the pasture they graze on, of course. But additional farmland is often needed to grow crops for animal feed.
Liu described the environmental impact of animal-based foods, especially cattle products, as “disproportionately large.”
There is more to the story
Still, these numbers are not a complete environmental scorecard for everything we eat.
The study focuses on land-related carbon storage and biodiversity. It does not measure every other impact associated with food production, such as methane from cattle, water consumption, transportation, processing, or every form of pollution. That distinction matters.
The carbon figure, for example, is not simply a measurement of emissions produced during one year. Instead, researchers estimated the long-term difference between the amount of carbon currently stored on agricultural land and what the natural vegetation and soil could potentially store there.
Think of it as the carbon storage the landscape has given up.
The footprint crosses borders
There is another wrinkle. The environmental damage caused by the food on your plate may have happened thousands of miles away.
The researchers estimated that 18% of food-related carbon and biodiversity losses were embedded in international trade. Animal products dominated many of those flows.
Brazil emerged as the largest net exporter of both types of environmental loss, while China was the largest net importer.
Does that make trade itself the problem? Not necessarily.
What it shows is that where food is produced matters enormously. National consumption figures can easily hide impacts happening somewhere else. Something sitting on an ordinary supermarket shelf may carry a land footprint from a biodiversity-rich ecosystem on the other side of the world.
Targeting hotspots could pay off
Here’s the encouraging part. Finding that one-third of farmland accounts for roughly two-thirds of these losses does not mean scientists are suggesting that one-third of agricultural land should simply be abandoned.
Instead, the maps could help governments, farmers, and companies figure out where changes could make the biggest difference. That could mean improving farming practices, protecting especially vulnerable habitats, or restoring some agricultural land to natural ecosystems where that is possible.
Changes in what people eat could help too. Food systems that require less land may ease pressure on some of the ecosystems that are hardest to replace.
And researchers have seen similar patterns before.
A 2020 Nature analysis found that strategically choosing areas for ecosystem restoration could greatly increase benefits for both climate and biodiversity.
A 2022 global cropland study also found that shifting some crop production away from high-impact locations could reduce environmental damage without lowering total crop output. Sounds simple? Not quite.
Any large change to agricultural production also has to consider farmers, local communities, food prices, and food security. Moving environmental pressure somewhere else would hardly solve the problem.
Some uncertainty remains
These maps are estimates. They are not a direct head count of every lost plant, bird, insect, or mammal.
The researchers combined several large datasets covering agricultural land, vegetation, soil carbon, biodiversity, food products, and global trade. Those datasets do not all come from exactly the same year, and some parts of the supply chain analysis carry more uncertainty than others.
The study’s biodiversity method also did not explicitly include pesticide use.
So the maps should not be read as a perfect photograph of every farm on Earth. They are better understood as a high-resolution guide to where environmental pressure appears to be most heavily concentrated.
A sharper map for action
Agriculture covers more than 40% of Earth’s habitable land. But its environmental impact is anything but evenly spread. That may be the study’s most useful message.
“The losses we see also represent potential gains,” Liu said. In other words, some of the places suffering the greatest losses could also offer the biggest opportunities for recovery.
Instead of looking at global agriculture as one enormous problem, these maps reveal its pressure points. Where is carbon storage being lost? Where is biodiversity taking the biggest hit? And which foods are connected to those places?
Now scientists have a much clearer idea.
The full study was published in Nature Food on Aug. 6, 2026.