How much food could the same field grow if farmers changed nothing but the climate kept warming? A new interactive tool suggests that, under its main higher-emissions pathway, 49% of the world’s population could live in areas projected to have lost at least 5% of their agricultural potential from 2041 to 2060. It is not a prophecy about exact harvests, but it is a warning about the adaptation challenge ahead.
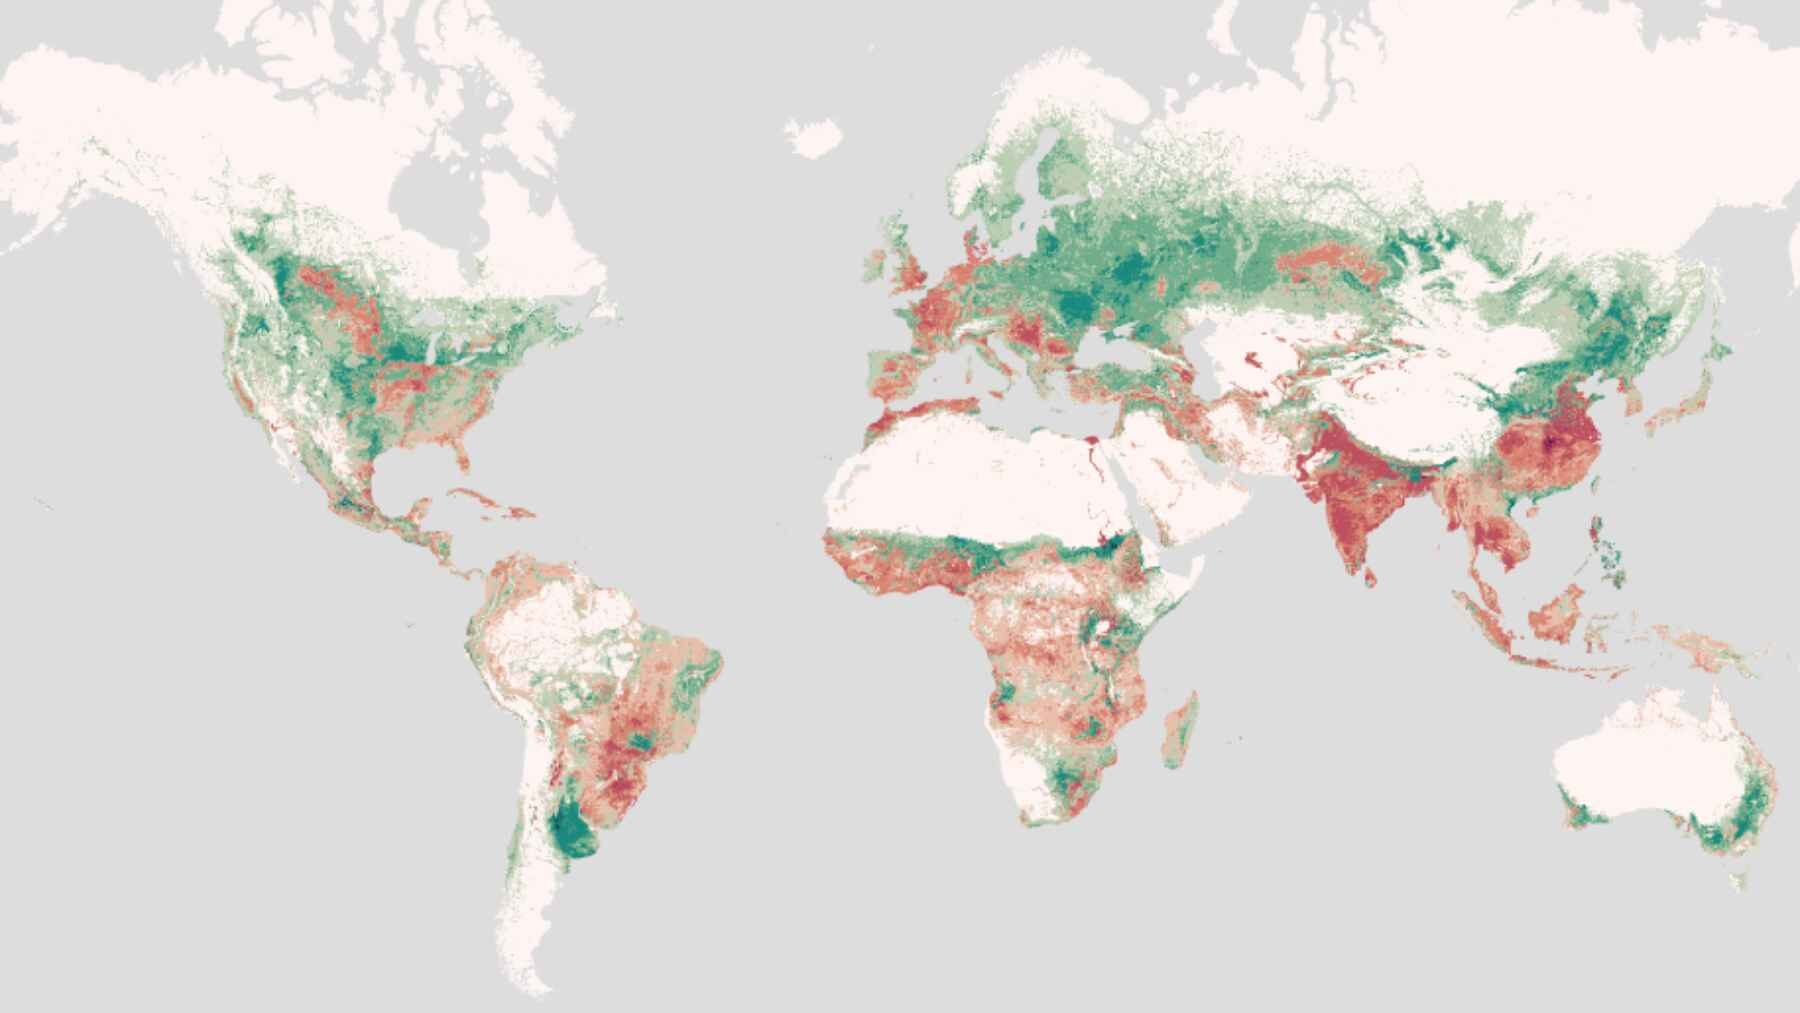
The CADI interactive map tracks observed and projected crop productivity across cells measuring about 5.8 by 5.8 miles. It finds that roughly one-sixth of global cropland has already lost more than 10% of its potential productivity. The tropics carry most of the damage, while some colder regions gain.
A climate stress test for farmland
The tool’s official name is the Climate-Driven Agricultural Decline Index. Laura Mayoral and Hannes Mueller coordinated the project through Spain’s Institute for Economic Analysis and the Barcelona School of Economics, while Björn Komander joined them as an author of the technical report. A Spanish National Research Council announcement also credits the Centre for Economic Policy Research, the United Kingdom’s Foreign, Commonwealth and Development Office, and the CEPR-ReCIPE initiative.
CADI measures “attainable yield,” meaning the maximum output that climate, soil and terrain could support under a stated level of farm management. It uses the Global Agro-Ecological Zones model, developed by the Food and Agriculture Organization and the International Institute for Applied Systems Analysis, together with AgERA5 climate records from Copernicus.
The researchers compare conditions in 1981 through 2000 with those in 2001 through 2020, then project change in 20-year blocks through 2100. They hold the 2020 crop mix, planted area and management practices constant. In practical terms, the map asks what climate alone does to today’s agricultural landscape.
The decline is already underway
More than 640 million people live in farming areas where the maximum number of people that local production could feed has dropped by more than 10% compared with 1981 to 2000. About 16% of all cropland has crossed that threshold. Among rainfed farms, which depend mainly on rainfall rather than irrigation, the share is around 20%.
The project estimates that 15% of the global population now lives in mapped areas with at least a 5% decline. Under the higher-emissions pathway highlighted by CADI and based on climate scenarios assessed by the IPCC, that exposure reaches 49% by mid-century. The pathway has a central warming estimate of about 3.8°F above the 1850 to 1900 average during 2041 to 2060.
That does not mean every resident will go hungry, but the same land could support fewer people if farming stays unchanged. Just 5% of agricultural land accounts for 35% of the total decline, and roughly one-quarter of countries could bear between 85% and 90% of global losses by mid-century. Countries with the smallest historical contribution to carbon dioxide emissions are also among the most exposed.
Spain mirrors the global divide
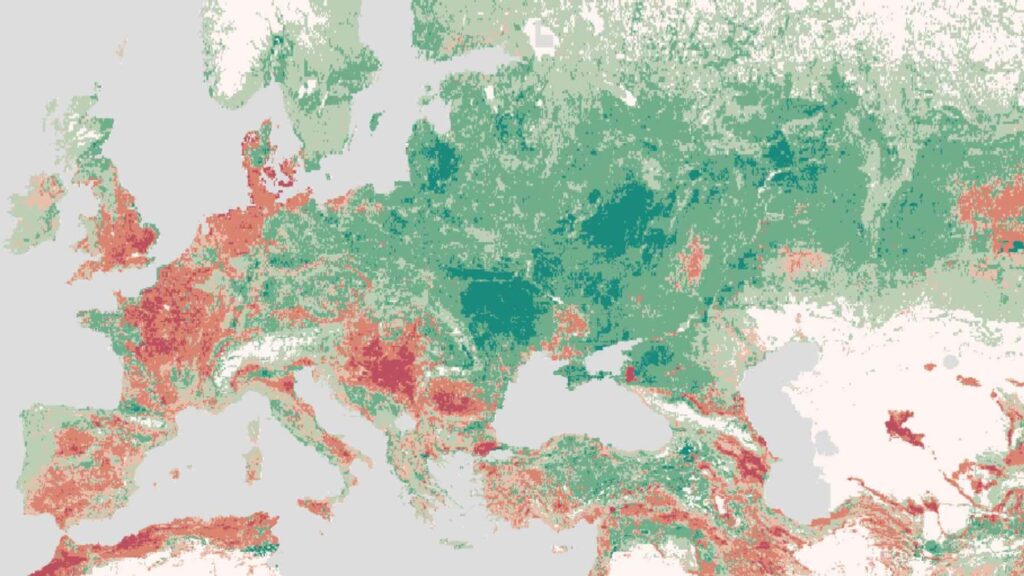
Europe shows a familiar north-to-south split. Scandinavia, Scotland and the Alps gain agricultural potential in the model, while much of southern Europe loses it. However, a large percentage gain in a cold area with limited output may add fewer calories than a smaller decline removes from an established food-producing region.
Spain reproduces that contrast within its borders. The Cantabrian coast, Galicia and the Pyrenees generally gain potential, while broad parts of the interior and east-central Spain show declines, including pockets of severe loss. A national average would blur that picture, which is why a grid of roughly six miles matters.
Even apparent winners could face difficult choices. Moving farming toward newly suitable areas can redirect land, water, labor and investment, creating competition between regions that did not previously depend on the same resources. A greener patch on the map is not a free bonus.
What the model does not predict
CADI deliberately excludes adaptation. It does not assume that farmers switch crops, expand irrigation, adopt heat-tolerant varieties, change planting dates or move production. That makes its projections a climate stress test, not a fixed forecast of supermarket shelves or the family grocery bill in 2100.
The assumption is strict, but it is not meaningless. A 2016 study of United States agriculture by Marshall Burke and Kyle Emerick found that long-term adaptation had offset less than half, and possibly none, of the productivity damage linked to extreme heat. That helps explain why the CADI team treats no adaptation as a serious benchmark, especially where farmers have limited access to credit and technology.
The tool converts major food crops into calorie equivalents and estimates how many people each cell could feed at 2,000 calories per day. It assumes those calories go directly to people, although real harvests may be used for animal feed or other purposes. The report therefore describes the measure as an upper limit, not a literal head count.
Why an early warning map matters
Governments can use the map to identify vulnerable districts before falling productivity cuts rural income, worsens food insecurity or pushes families to leave. Support may include crop research, water management, extension services, new technology and planned shifts in production. The right response will vary from one region to the next.
At the end of the day, CADI’s strongest message is not that agriculture will simply disappear. Climate pressure arrives unevenly, often in places with the fewest resources to absorb it. Planning can reduce the damage, but waiting leaves fewer choices.
The official technical report has been published on the CADI project website.