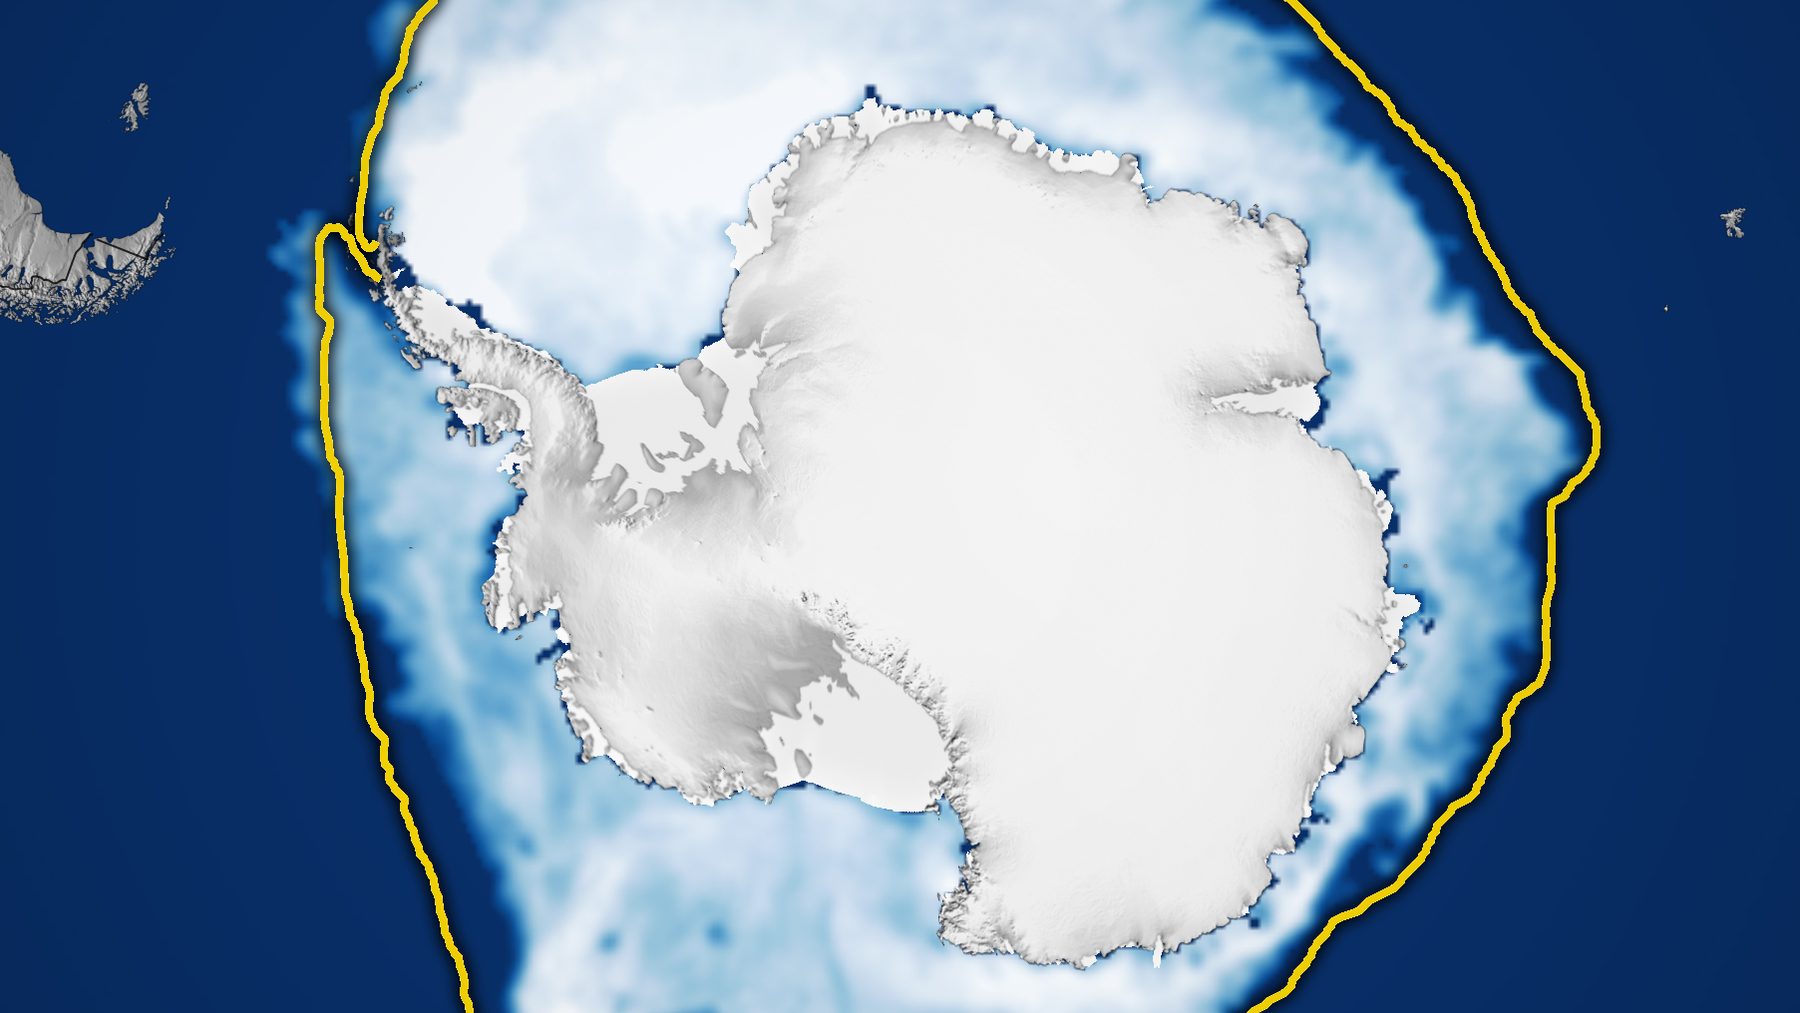
Antarctic sea ice reached its largest extent of 2026 on September 14. It covered an estimated 6.79 million square miles (17.59 million square kilometers) of the Southern Ocean. NASA Earth Observatory and the National Snow and Ice Data Center (NSIDC) rank that peak as the third-lowest winter maximum in the satellite record.
That low ceiling followed a summer that looked almost normal. Less than three weeks after the peak, the ice was shrinking fast enough to set record lows for the date.
A near-average February that faded
At NSIDC, part of the University of Colorado Boulder, scientists reported the ice bottomed out at 996,000 square miles (2.58 million square kilometers) on February 26. Their March 9 report ranked it sixteenth lowest in 48 years of satellite data.
That minimum still sat 100,000 square miles below the 1981 to 2010 average. Even so, it came much closer to normal than the four summers before it.
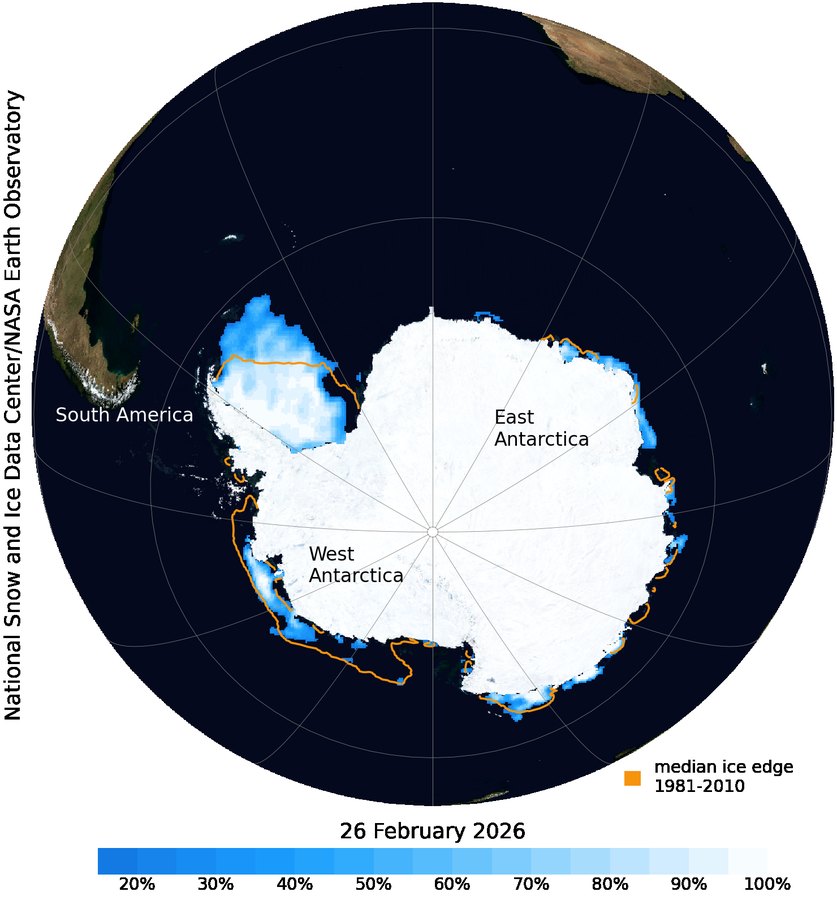
Ted Scambos, a senior research scientist at the Cooperative Institute for Research in Environmental Sciences (CIRES), blamed the weather. In January and February, he said, strong winds from the south pushed sea ice outward in the Weddell Sea. “This slowed the overall decline in extent, leading to a near-average minimum,” he added.
His colleague Walt Meier, of the NASA NSIDC Distributed Active Archive Center, was not surprised. He said the “return to less extreme conditions is not unexpected given the large year-to-year variation of Antarctic sea ice seen in the satellite record.”
Lagging the average all winter
The ice started growing again in late March and never caught up. In a September 23 update, NSIDC said extent had tracked near record lows for most of the growth season.
“Antarctica’s sea ice during this year’s growth season has steadily lagged the long-term average,” Scambos said. “This is a continuation of below-average extent across all seasons for most of the past decade.”
The center first called September 14 a likely peak. Large swings are typical near the maximum, which usually comes in late September or early October. It has arrived as early as August 30.
A continent ringed by open ocean
Geography makes the Antarctic cycle unusually wide, according to NASA Earth Observatory. The Arctic is an ocean basin hemmed in by land, while Antarctica is a continent surrounded by water. Winter ice there has room to spread north.
Ice that stretches into warmer latitudes also melts more each summer, so the cover usually peaks near the end of the southern winter and shrinks to a minimum in February.
Not all Antarctic sea ice drifts, because some of it holds fast to the coastline. Small grounded icebergs may help pin that coastal sea ice in place, while pack ice farther out moves with winds and currents.
Record highs until 2014
For decades, the southern ice seemed to defy the warming trend. NASA reports that it grew by about 1 percent per decade from 1979 to 2014. Satellites logged record winter highs in 2012, 2013 and 2014, while Arctic ice was in steep decline.
That climb ended in 2015, and significant decreases began in 2016. Coverage has mostly stayed below normal despite small rebounds. In 2023 the region set both its record low minimum and its record low maximum.
Counting pixels at 15 percent
Satellites read ice concentration on a grid of cells about 16 miles (25 kilometers) wide. NSIDC counts a cell as ice-covered when ice fills at least 15 percent of it. Add those cells up and you get the extent.
A cell can be mostly open water with scattered floes and still count in full. Thickness is a separate measurement, which NASA says comes from radar altimeters such as the European Space Agency’s CryoSat-2.
Passive microwave sensors make the daily count possible, NASA explains. They measure the microwave energy Earth naturally emits, and sea ice gives off more of it than open water. Because microwaves pass through clouds, the satellites watch the ice in any weather.
NASA’s Nimbus-7 started the record in late 1978, and Defense Meteorological Satellite Program satellites followed in 1987. NASA’s Aqua helped from 2002 to 2011. Since 2025, scientists have used the Japan Aerospace Exploration Agency’s GCOM-W satellite.
Record daily lows since October 2
After the peak, extent fell sharply through September. NSIDC’s October 7 analysis reported record low daily values from October 2, beating the marks of 2023. Most of the losses came in the Ross and Amundsen seas and the Indian Ocean sector.
Bright ice reflects far more sunlight than dark water. With less ice, the ocean absorbs more heat and can melt still more ice, a loop NASA calls the ice-albedo feedback.
Seals and penguins use the ice as habitat, NASA notes, and summer melt releases nutrients that feed phytoplankton. Satellite projects that read penguin diets in guano stains or follow emperor colonies by radar already watch that web from orbit.
Melting sea ice barely nudges sea level, since it already floats. NSIDC notes that ocean warming and land ice melt matter far more, including the loss of ice from Greenland and Antarctic glaciers.
Trend or fluctuation, still unsettled
NASA says scientists will keep observing the region every year to learn whether the decline since 2016 is “part of a long-term change or a statistical fluctuation.”
NSIDC calls its 2026 extent numbers preliminary, and NASA Goddard’s later quality checks can move values by 12,000 to 19,000 square miles (30,000 to 50,000 square kilometers). In the Arctic, a revision like that once pushed the date of the 2024 minimum two days later.
The findings were published by NASA Earth Observatory on October 12, 2026.
Image: NASA Earth Observatory / Michala Garrison, using data from the National Snow and Ice Data Center