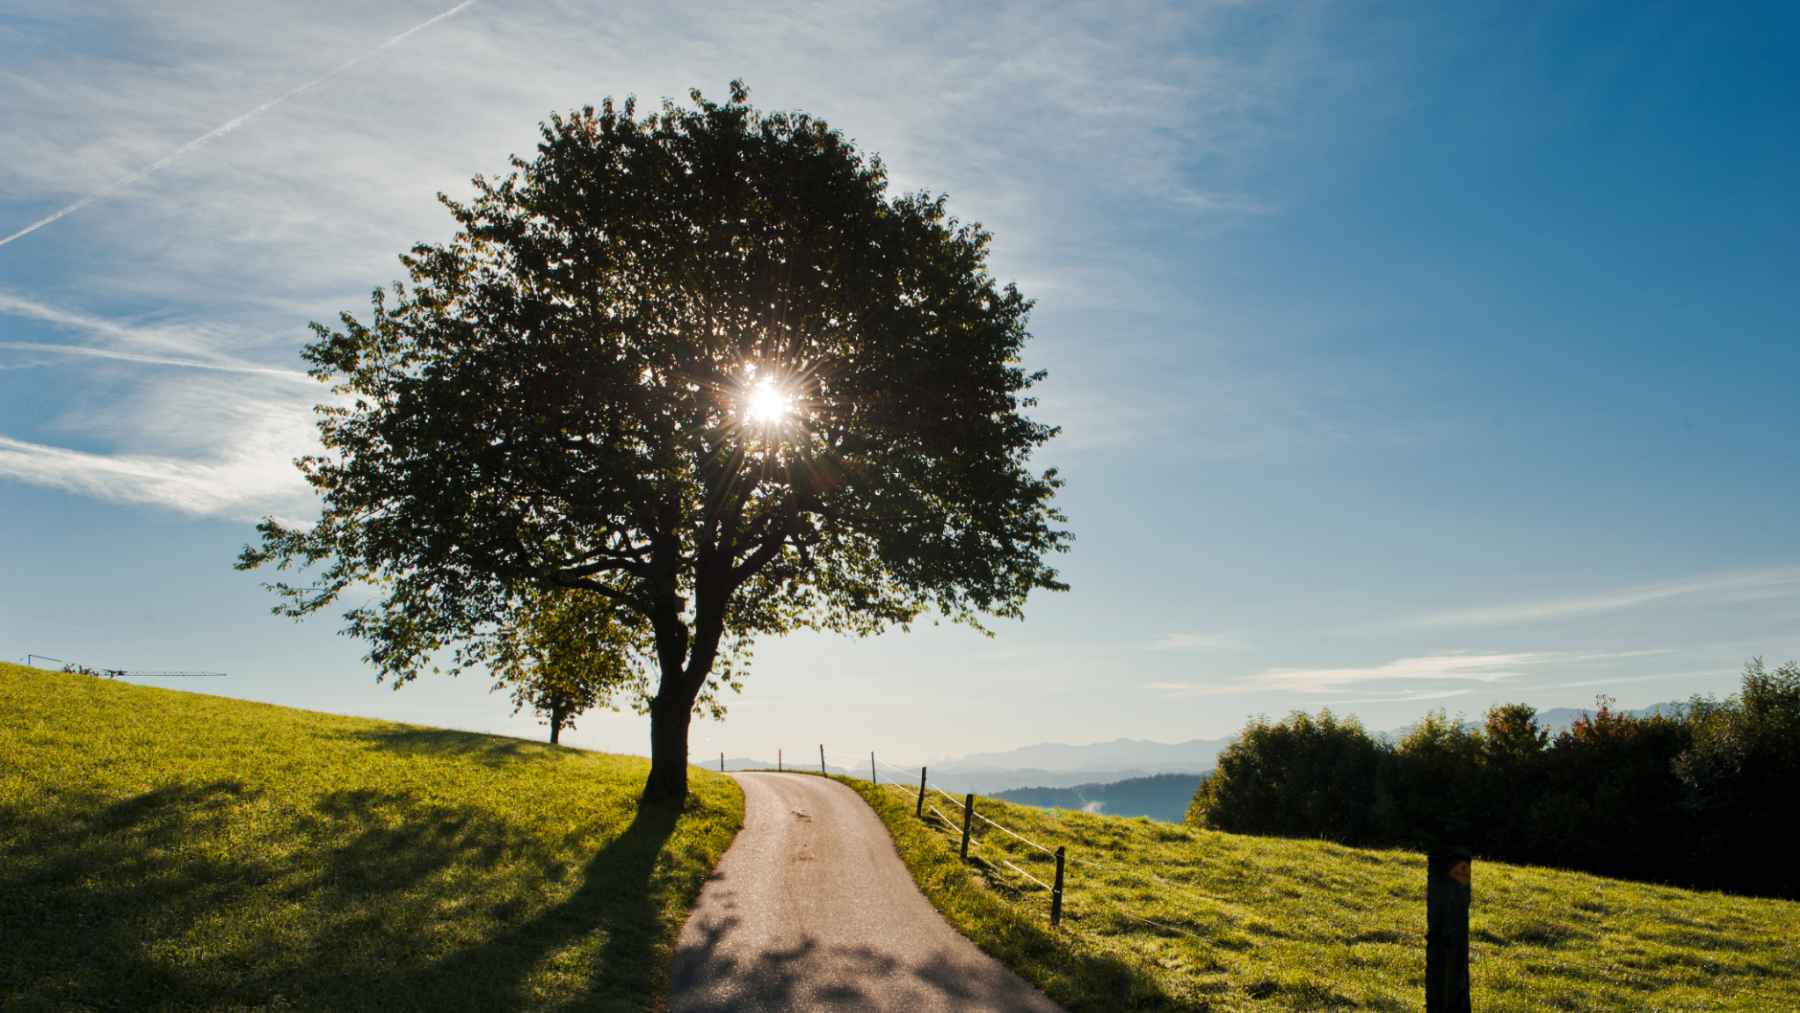
How much sunlight reaches the ground beneath a forest, beside a highway, or on a snowy mountain slope? In Switzerland, scientists now have an unusually detailed answer. A new national map shows light and shade across the country at a scale of about 33 feet, fine enough to account for the shadow of individual trees.
Researchers at the WSL Institute for Snow and Avalanche Research (SLF) have calculated ground-level light across both open and forested landscapes, making the data public through the EnviDat platform. The work matters because sunlight is not just something we notice on a walk. It helps decide when snow melts, where plants and animals can thrive, and how local microclimates form.
A map of light and shade
The project focuses on “light availability,” which simply means how much light actually reaches the land surface after mountains, hills, tree crowns, and buildings cast their shadows. Think of it as the difference between standing in an open parking lot at noon and standing under a thick tree canopy.
That difference can change quickly. One patch of ground may sit in sunlight for hours, while a nearby patch remains cool and shaded for most of the day. In mountain terrain, that small shift can have big consequences.
The new dataset, called SwissRad10, follows those changes hour by hour through a full annual solar cycle. This means researchers can look at how light changes across seasons, not just from morning to afternoon.

Why snow scientists care
Snow is one of the main reasons this map matters. Across Switzerland, about one third of precipitation falls as snow, and that frozen water affects floods, hydropower, winter sports, and local ecosystems.
When sunlight reaches a snowpack early in the year, snow tends to melt faster than it does on shaded slopes nearby. That can influence river levels and flood warnings, especially during spring melt. For anyone downstream, this is not an abstract detail.
Hydropower is part of the story too. Better snowmelt forecasts can help managers understand when water may flow into reservoirs. At the end of the day, that can connect mountain shadows to very real energy decisions, even the kind that eventually show up in the electric bill.
Every tree shadow counts
To build the map, the research team used high-resolution data from the Federal Office of Topography swisstopo. Clare Webster, working with Christian Ginzler, Mauro Marty, Anita Nussbaumer, Giulia Mazzotti, and Tobias Jonas, used that information to model how terrain and tree canopies block or filter sunlight.
This is where the map becomes especially interesting. The model does not treat forests as one flat green blanket. Instead, it takes into account the shapes of tree crowns, forest gaps, and the way sunlight moves across the sky.
Deciduous trees and larches added another challenge because they lose their leaves in autumn. That means more light can reach the ground through winter and early spring. A forest is not the same light environment all year.
Forests create tiny climates
Inside a forest, conditions can change over just a few feet. One spot may be damp and cool, while another gets enough sun to warm the ground and help small plants grow. These small zones are called microclimates, which are local climate pockets within a larger area.
Why should anyone care about such tiny differences? Because plants, insects, fungi, and animals often depend on them. A shaded, moist patch can become a refuge during summer heat, while a sunnier patch may melt out earlier in spring.
An earlier version of the dataset was already used in microclimate mapping research in Switzerland, helping scientists show how solar radiation shapes forest temperature patterns and local habitat conditions. That matters more as heat waves and shifting seasons put pressure on ecosystems.
A tool for floods and forests
The data is not only for academic research. It could help people who manage forests, monitor natural hazards, study biodiversity, or plan conservation work. Better sunlight maps can also sharpen environmental models that depend on land surface energy.
A related study on mountain forests in the central European Alps found that forests can influence snow cover in different ways depending on elevation, slope direction, weather, and region. In some cases, forests reduce peak snow storage but slow down melting, especially on sunny slopes. Nature rarely gives one simple answer.
That is why this new map is useful. It gives researchers a more realistic view of what is happening close to the ground, where snow melts, seedlings grow, and animals search for shelter.
Switzerland in high detail
Switzerland is a natural testing ground for this kind of map. Much of the country is mountainous, and about one third of its land is covered by forests. Put mountains and forests together, and sunlight becomes a moving puzzle.
The SwissRad10 dataset uses remote sensing, including airborne laser measurements, to represent terrain and forest structure. Laser measurements, often called lidar, work by sending light pulses and measuring what bounces back. In simple terms, they help scientists build a three-dimensional picture of the landscape.
That picture lets the model estimate direct sunlight and scattered light at ground level. The result is not just a pretty map. It is a working tool for studying water, forests, climate, and life at a scale people can actually recognize.
What happens next?
The new map will likely become most valuable when combined with other environmental data, such as snow depth, soil moisture, plant surveys, and weather records. One layer tells part of the story. Many layers together can show why one hillside behaves differently from another.
For hikers, gardeners, skiers, and anyone who has searched for shade on a hot day, the idea is easy to grasp. Sunlight is uneven. What this project adds is a way to measure that unevenness across an entire country, hour after hour.
In the end, the map turns something ordinary into data. A tree shadow on the ground may look small, but across Switzerland, those shadows can help explain snowmelt, habitat, water flow, and the quiet climate differences we feel every day.
The main study has been published in Scientific Data.