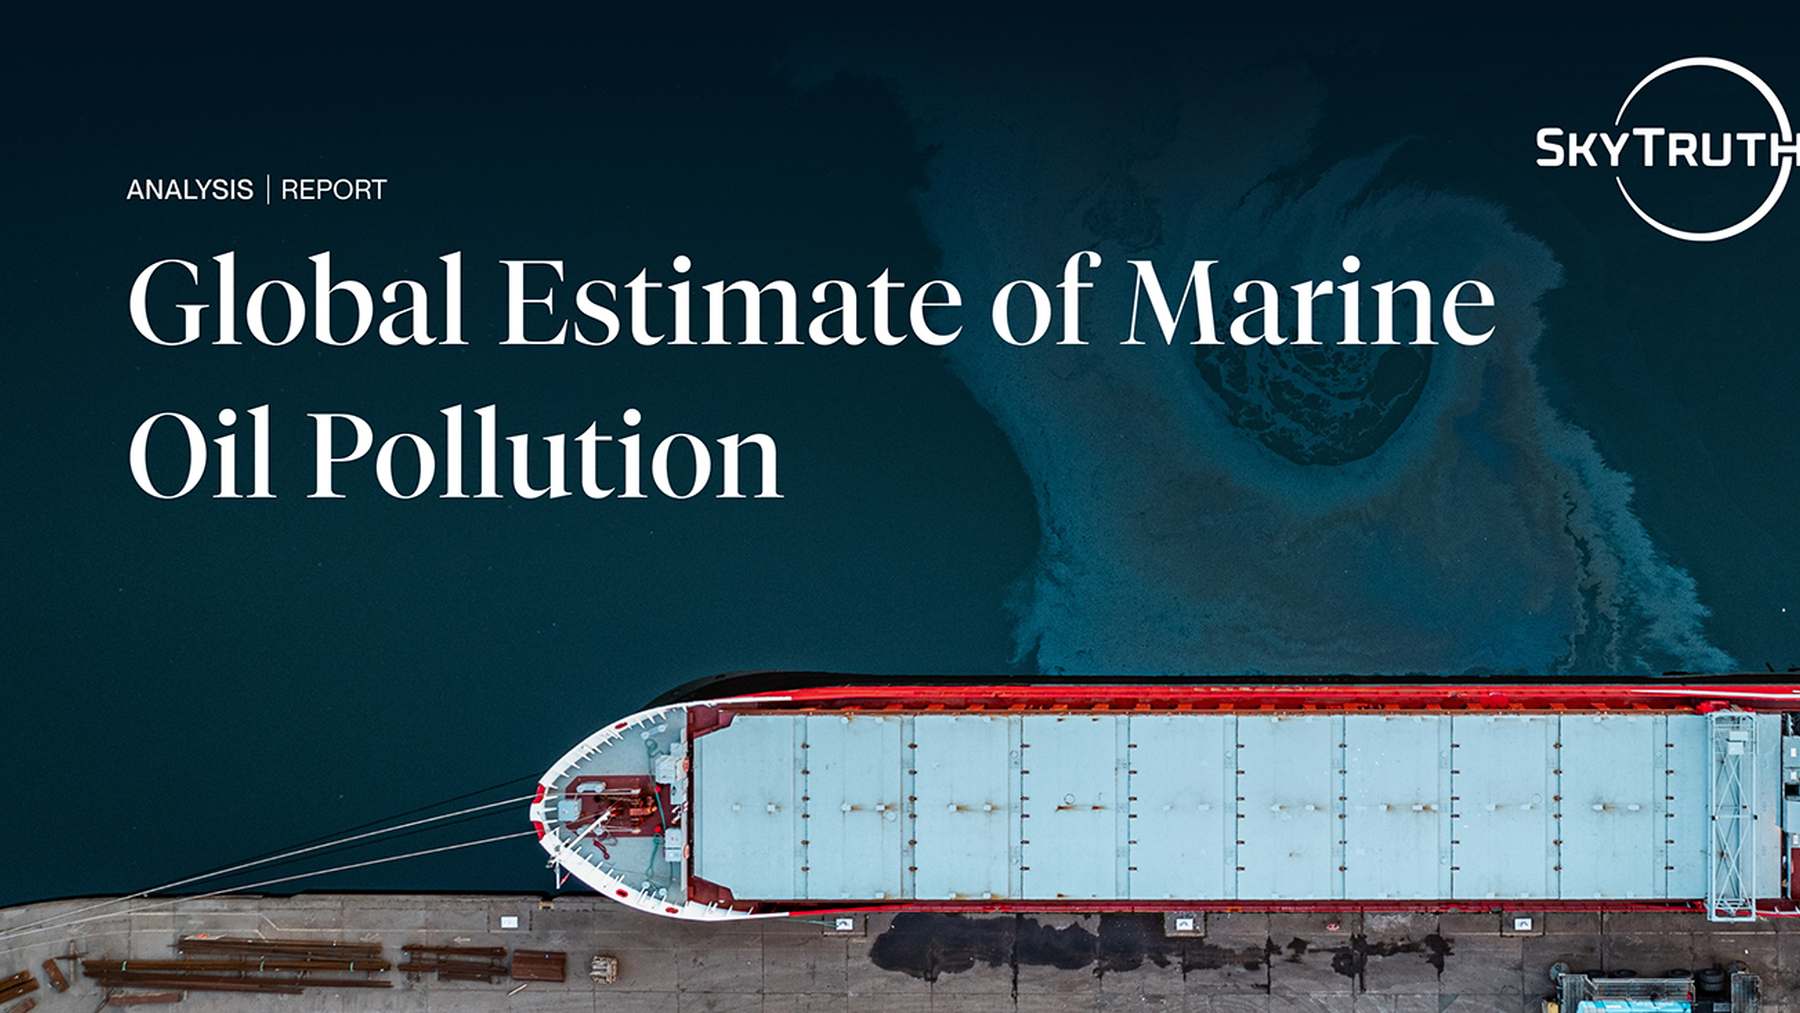
The Princess Aweni was built as a tanker in 1975 and ended up as a floating oil production vessel off Nigeria. Before a court seized it in 2026, satellites caught oil slicks beside it in more than 15 percent of the radar images they took.
It is one of the repeat polluters named in a new global estimate from SkyTruth, a West Virginia nonprofit that tracks pollution from space. The group’s model puts the ocean surface covered by slicks from ships and offshore platforms at about 610,000 square miles (1.58 million square kilometers) every year, more than twice the size of Texas.
“Oil pollution is a constant, global issue that happens far more often than the spills that make headlines,” Karl Wurster, SkyTruth’s chief technology officer, said in comments reported by Euronews. The analysis came out on September 23, 2026, during Climate Week NYC.
Most of this oil never makes headlines
“Oil pollution has long been a significant problem in the ocean, but poorly quantified,” the report begins. “Public awareness and media attention tend to focus on catastrophic oil spills like the 1989 Exxon Valdez tanker spill or the 2010 Deepwater Horizon disaster. However, this is far from the only source of oil contamination at sea.”
The report looks instead at routine releases, such as oily bilge water pumped off ships and produced water, the salty waste that comes up with oil and gas from offshore wells. “In most cases, this activity is illegal under mechanisms including the 1973 MARPOL Convention, but it frequently passes without notice or accountability,” the authors write.
John Amos, who founded SkyTruth and is now its chief executive officer, described the scene in a 2022 blog post. “Tens of thousands of massive cargo ships and tankers crisscross the oceans every day. Far too many of these vessels leave long, oily slicks in their wake, a telltale sign of the discharge of untreated oily wastewater directly into the sea,” he wrote.
Radar does the counting
The estimate relies on the European Space Agency’s Sentinel-1 radar satellites, which “unlike optical satellite imagery, can image through clouds and at night,” according to the report. SkyTruth’s Cerulean software scans those images for slicks with machine learning and then looks for the ship or platform that was nearby.
Across 2023, 2024, and 2025, analysts verified 3,152 of those slicks. Put together, they would cover about 8,800 square miles (22,805 square kilometers), roughly as much as New Jersey.
From there, SkyTruth says, “We developed a model to estimate the annual global oil slick area from vessels and offshore facilities using oil slicks captured by Cerulean from 2023 to 2025, while addressing inconsistencies in satellite coverage and vessel density.”
The analysis “suggests that most slicks are close to shore, with fewer predicted farther out to sea. This is likely because vessel traffic is concentrated along coastlines,” they write.
Chuanmin Hu worked on a 2022 study in Science that ran a similar search through more than half a million radar images from 2014 to 2019. “Most of these oil slicks are microscopically thin, widely observed, and different from major oil spills,” Hu, a professor at the University of South Florida’s College of Marine Science, said at the time. “They are a source of chronic pollution and have traditionally been hard to track because they are short-lived and move with the winds, tides, and currents.”
Tankers and cargo ships lead the list
Ships, including “dark” vessels that were not broadcasting their location, were tied to roughly 81 percent of the slick area that could be traced to a source. Offshore oil infrastructure accounted for about 18 percent.
“Cargo ships and tankers are the types most frequently seen to be vessel sources in Cerulean,” the report says. Out of 25,156 tankers worldwide, 1,566 were associated with detected slicks, and so were 2,495 of 45,042 cargo ships.
China had the most ships linked to slicks, 704, though that was only 0.35 percent of its fleet, while Palau ranked first by share. “Fleets flying flags of convenience, including Palau, Panama, Malta, Comoros, Cyprus, and the Bahamas, are linked to oil slicks at rates disproportionate to their fleet size, pointing to weak flag-state oversight as a possible cause,” the authors write.
Some of the densest slicks turned up in the Red Sea, the Persian Gulf, the Mediterranean, the Black Sea, off West Africa, and around Indonesia. The Persian Gulf was already a worry this year, after more than 68 stranded oil tankers near the Strait of Hormuz raised the risk of a spill.
The same ships keep turning up
Sixteen vessels appeared to be discharging oil in more than 10 percent of the satellite observations made of them at sea. The worst was the African C, a Palau-flagged general cargo ship, linked to slicks in 26.7 percent of the images taken while it was moving.
Next came the Russia-flagged tanker Klavdia V, at 21.4 percent, and the Indonesia-flagged tanker Summer Palace, at 20 percent. A structure off Indonesia showed slicks in nearly 29 percent of its images, and one off Nigeria was tied to 42 verified slicks.
“Although there may be fewer infrastructure sources in Cerulean, a small number of platforms can release a disproportionate amount of oil pollution into the ocean,” the report notes. Off the Democratic Republic of the Congo, more than 80 percent of the slick area came from oil infrastructure.
“We like to say we make the invisible, visible, and present it to people so that they can see for themselves. And by making it visible, you make it measurable and actionable,” Amos told WMAR 2 News in 2021.
Owners are hard to pin down
For more than half of the polluting vessels, the team found no ownership data at all. Only 6.9 percent of the Palau-flagged vessels the team looked up had ownership information, compared with 73.2 percent of those flagged to the Bahamas.
“When ownership data was available, beneficial control repeatedly traced back to a handful of established maritime economies regardless of where the vessel was flagged,” the authors write. Panamanian-flagged ships most often led to Japanese companies, and Liberian, Marshall Islands, and Bahamian ships most often to Greek ones.
Oil drifts into protected waters
“Despite their protected status, many sensitive areas show some level of oil pollution,” the report says. The oil does not necessarily start inside them, the report adds, since “it can occur when slicks drift in from vessels and platforms operating outside the borders of protected areas.”
In the Republic of the Congo’s Conkouati-Douli National Park, the team hand-labeled 27 slicks. “All the slicks originated from three structures located outside of the coastal park’s protected waters and drifted in,” they write. Those waters hold nesting leatherback and olive ridley sea turtles, along with sharks, rays, dolphins, whales, and manatees.
In a Mediterranean migration corridor off Spain, all 45 slicks the team labeled came from vessels, and 20 different ships were identified.
The most polluted marine mammal area covers the outer continental shelf of the Gulf of Mexico, the main home of the critically endangered Rice’s whale. Only about 51 are thought to survive, and much of the oil there comes from platforms.
The authors write that this pollution “will almost certainly be exacerbated by a recent Trump administration decision to waive endangered species protection in the Gulf of Mexico in favor of rapid oil extraction, citing national security as the justification.”
Three of the 10 most polluted marine mammal areas are in the Mediterranean, a sea with less than 1 percent of the ocean’s surface and about 15 percent of world maritime trade. “Drilling infrastructure and chronic pollution from busy energy corridors transporting oil and gas are significant stressors for the vulnerable areas,” the report says.
What the numbers cannot show
The yearly figure measures slick area, not how much oil was spilled. It also leans on modeling in the places satellites rarely look, and the high seas, nearly two-thirds of the ocean, are almost entirely modeled.
“Limited coverage, especially on the high seas, means substantial areas are essentially unmonitored, creating a major observability gap in the open ocean,” the authors write. Of the link between ship traffic and slicks they used to fill that gap, they add, “The resulting relationship is significant but noisy, so we are less confident in these extrapolated values.”
Slicks near known natural seeps were removed, since oil and gas also leak from the seabed on their own, as at the cold seeps scientists traced off Trinidad and Tobago. The list of repeat polluters is probably short, too, because “source attribution in shipping lanes is challenging, and polluters that routinely travel in shipping lanes may be missed by our source association.”
“It shouldn’t be up to small nonprofit organizations landlocked in West Virginia to be showing you what’s happening,” Amos said in that 2021 interview. “Governments can and should be doing this and making it publicly transparent.”
The report closes on the same note. “Closing these observability and accountability gaps is essential for protecting marine ecosystems and turning existing protected-area designations into meaningful protection from oil pollution,” the authors write.
The full analysis was published by SkyTruth on September 23, 2026.
“A global picture can help focus regulation and enforcement to reduce oil pollution,” Yongxue Liu, a professor at Nanjing University and the corresponding author of the 2022 Science study, said when that work was released.
Image: SkyTruth