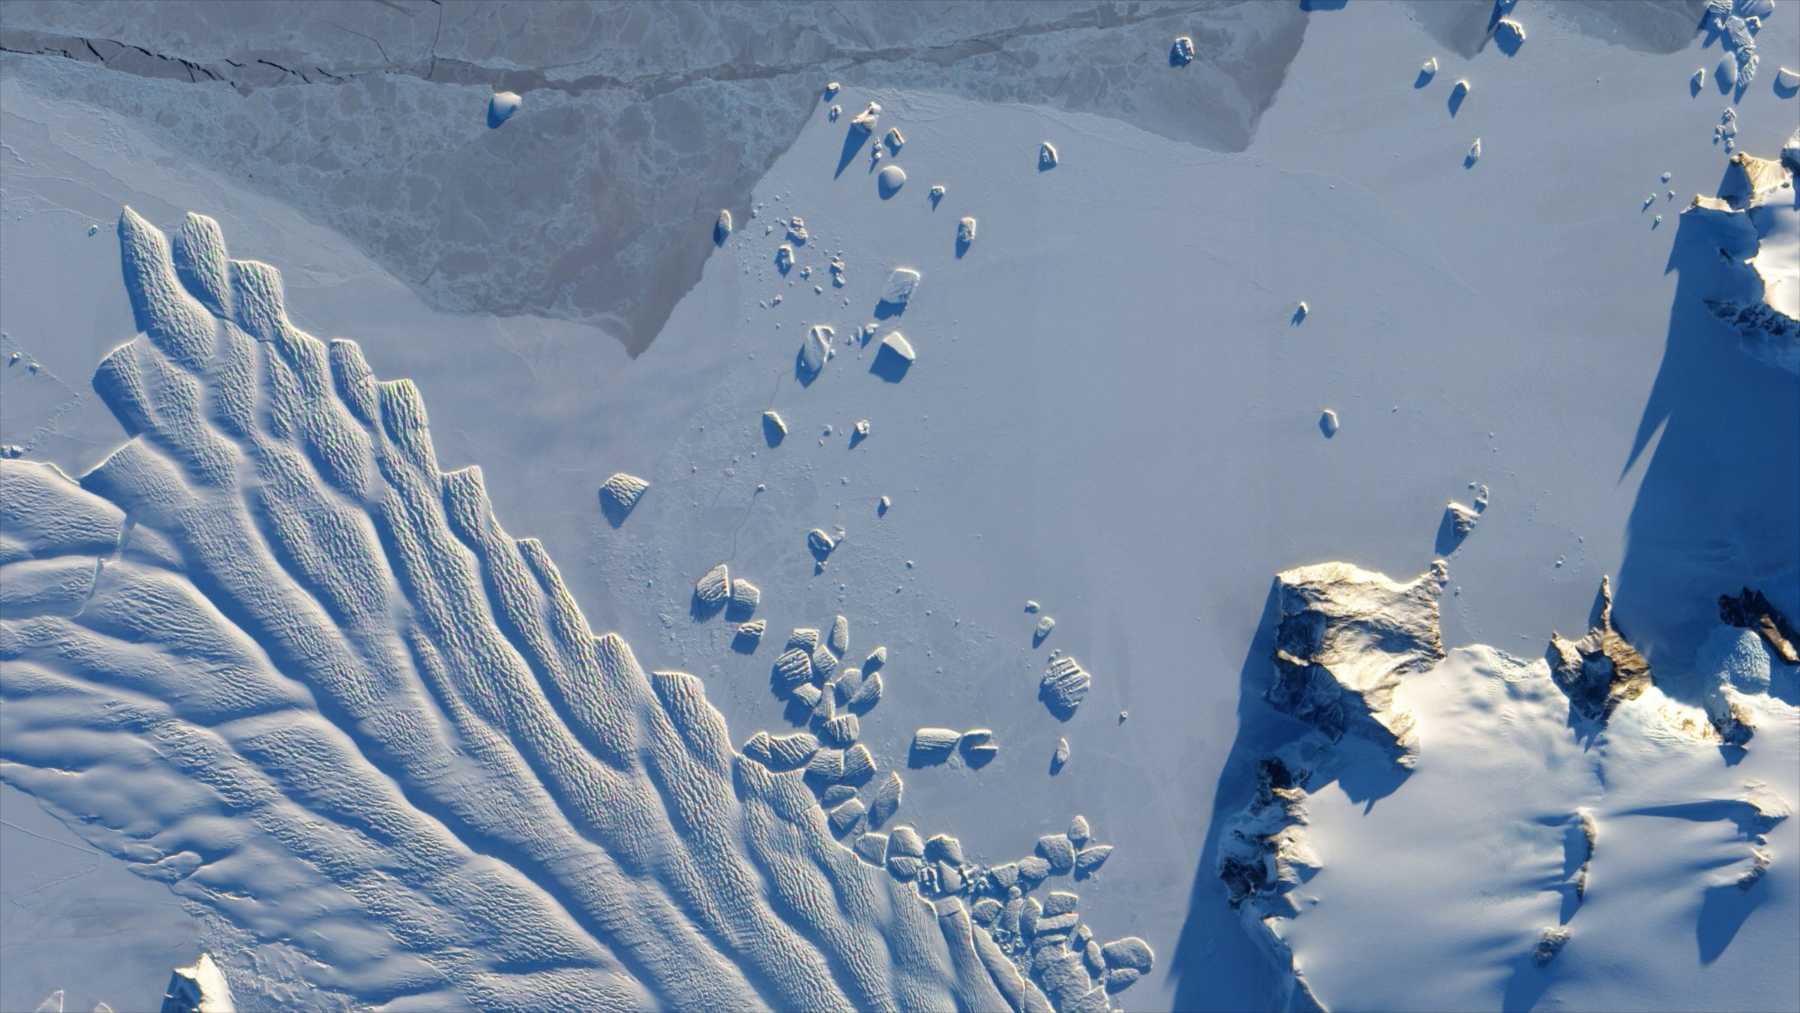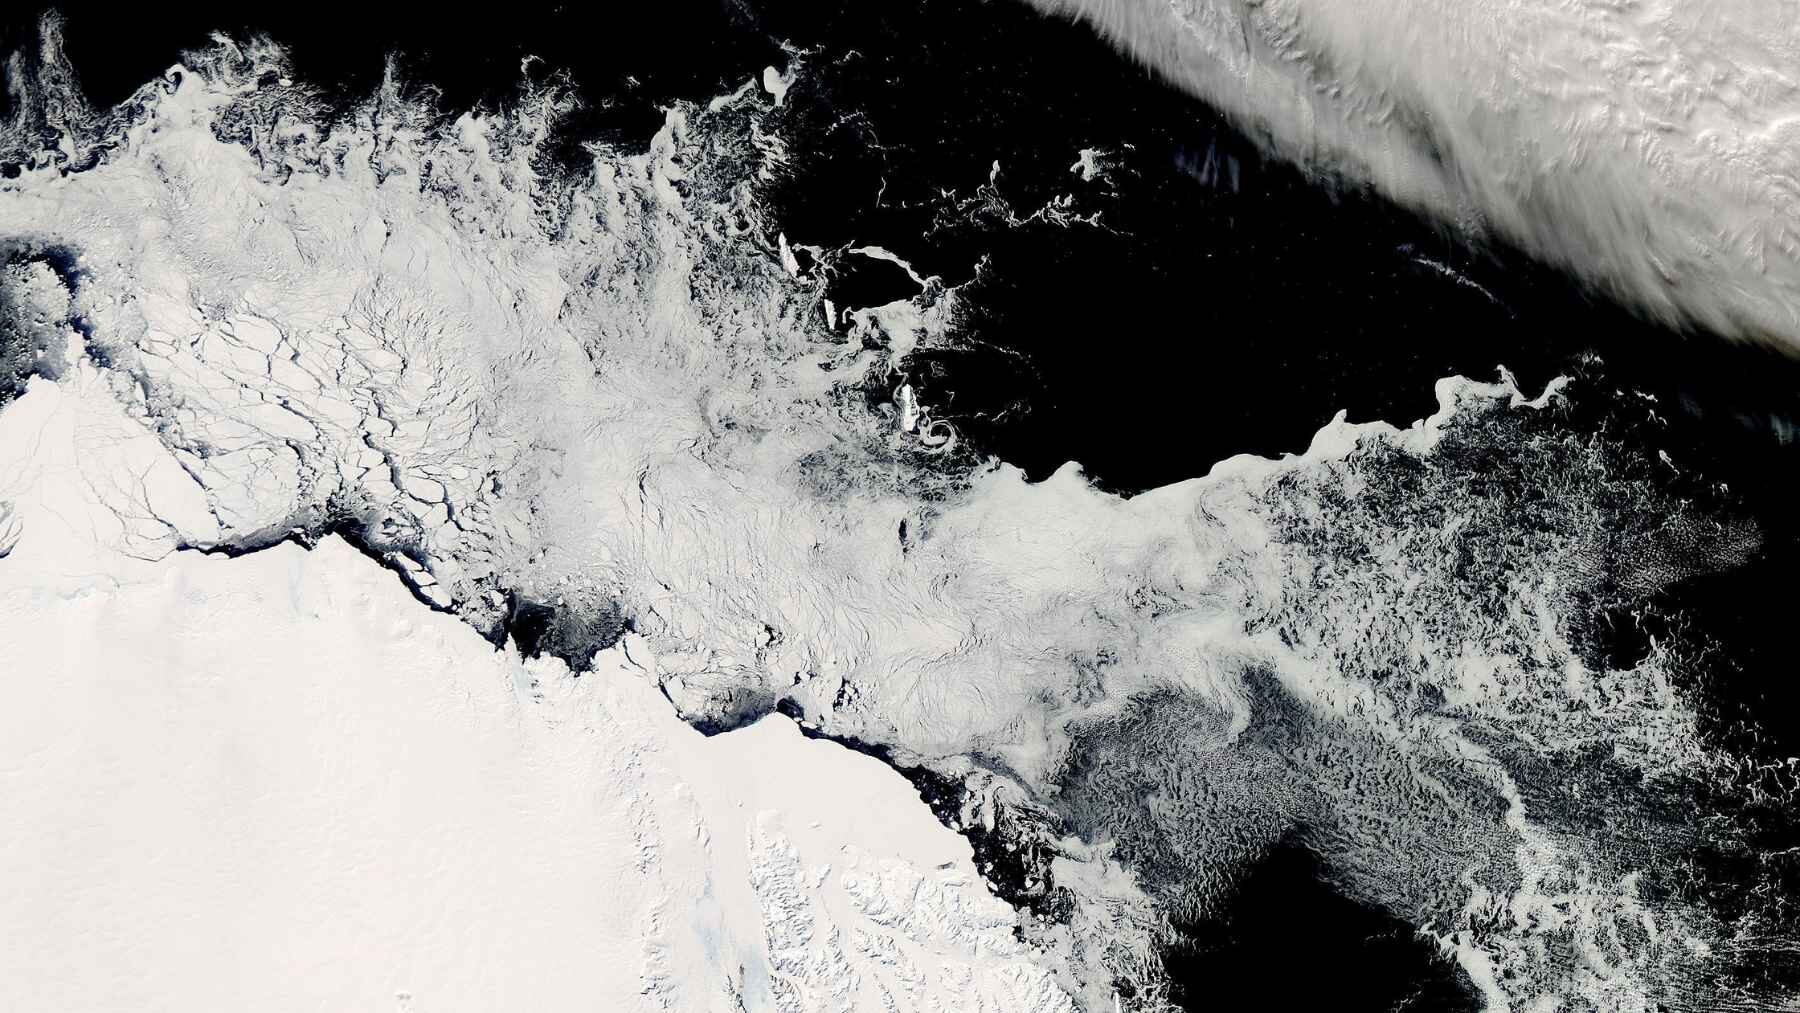
At the very bottom of the Southern Ocean, a vast layer of cold, dense water is getting smaller. Slowly, but steadily.
A new observation-based study estimates that Antarctic Bottom Water lost about 2.9% of its circumpolar volume between 2002 and 2023. And since 2015, things have moved much faster. The yearly rate of decline was roughly four times the pace measured across the full record.
Why does that matter? Because this hidden water mass does much more than sit near Antarctica. It carries oxygen into the abyss, stores heat and carbon, and eventually fills as much as 40% of the global ocean.
Changes down there can ripple through the climate system for centuries. Still, the research does not show that the entire global ocean circulation is about to shut down.
The ocean’s coldest return flow
Antarctic Bottom Water forms mainly near the Weddell Sea, Ross Sea, Adélie Coast, and Cape Darnley. When seawater freezes, most of the salt stays behind. That leaves nearby water colder, saltier, and heavier.
Think of it as the ocean making a concentrated batch of salty water. Heavy enough to sink.
The water then spills down the continental slope and spreads north along the seafloor into the Atlantic, Indian, and Pacific Oceans.
It acts like a deep return lane in the planet’s overturning circulation, carrying oxygen downward while helping keep heat and carbon away from the atmosphere.
A smaller Antarctic Bottom Water volume does not mean ocean water has vanished. Instead, lighter water is taking over some of the space once occupied by this dense bottom layer.
How scientists mapped the abyss
There is an obvious problem. Satellites cannot simply look through miles of seawater and see what is happening at the bottom.
So the researchers used another approach.
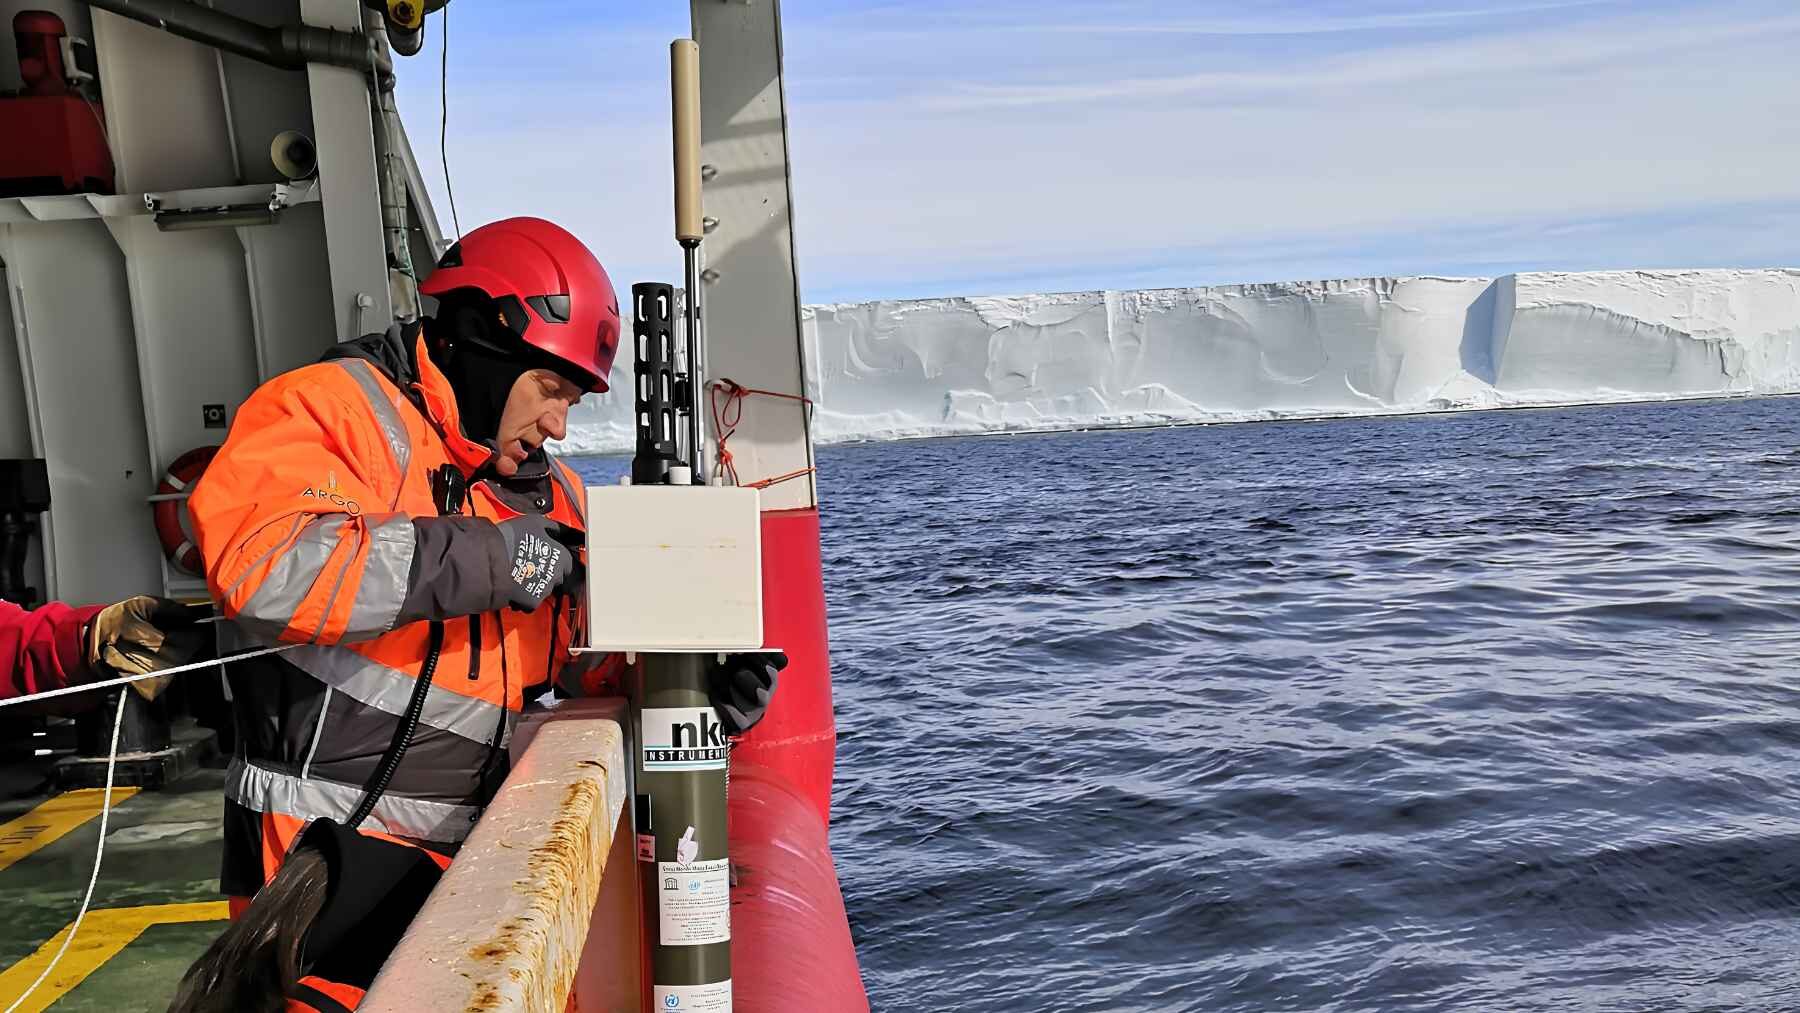
Their method, called SatGEM-2, combines satellite measurements of sea surface height with historical temperature and salinity profiles collected by research ships and ocean floats.
It sounds complicated. The basic idea is simpler.
Changes deep in the water column can leave a subtle fingerprint at the surface, a little like a mattress changing shape depending on where weight is placed on it.
The researchers reconstructed monthly conditions from January 2002 through December 2023 across the ice-free Southern Ocean.
They also checked the results against 201 independent Deep Argo profiles and repeated ship surveys. The agreement was close, giving the researchers confidence that the method was capturing what was really happening deep below the surface.
The decline sped up after 2015
Across the full record, Antarctic Bottom Water volume fell by an average of about 0.09% per year.
Then came 2015.
From that point onward, the estimated decline jumped to about 0.35% per year. By 2023, the total volume was roughly 2.9% below the 2002 baseline, with an uncertainty of about 1.4 percentage points.
Lead author James Wyatt, with the Australian Antarctic Program Partnership at the University of Tasmania’s Institute for Marine and Antarctic Studies, put it simply.
“We find that AABW has steadily shrunk in volume since 2002,” he said.
The change was not the same everywhere.
The Weddell sector recorded the largest and most persistent loss. Cape Darnley and the Australian Antarctic sector also shifted toward faster decline after 2015.
The Pacific sector actually gained bottom-water volume. there is a catch. That region holds less than one-tenth of the circumpolar total and varies sharply from year to year.
Sea ice is part of the puzzle
Something else happened around the same time.
The acceleration in bottom-water loss coincided with the sharp decline in Antarctic sea ice that began in 2016. The two records also moved closely together.
That makes physical sense.
When sea ice forms, salt is pushed into the surrounding water. This process helps create the dense shelf water that eventually feeds Antarctic Bottom Water.
Less sea ice could therefore matter. A lot.
But there is an important distinction. Sea ice extent is not the same thing as sea ice production, and a strong correlation does not prove that one directly caused the other.
The researchers are careful about that.
Freshwater changes the recipe
Melting Antarctic ice adds freshwater to the Southern Ocean.
Freshwater is less dense than salty water. Add enough of it, and the surface becomes harder to sink.
Think of it as watering down a heavy brine. The recipe changes.
Previous research has found that Antarctic meltwater can reduce Antarctic Bottom Water formation and allow warmer Circumpolar Deep Water to move closer to the continental shelf.
That raises an uncomfortable question. Could weakening bottom-water formation make it easier for warmer water to reach Antarctica’s ice?
Potentially. If less dense bottom water forms, warmer water can occupy more of the abyss and may gain easier access to ice shelves. At the same time, the deep ocean could receive less oxygen-rich water.
Still, the new study did not isolate a single cause. Nor did it directly measure a complete slowdown of Southern Ocean overturning.
There is more to learn.
What the satellites still miss
SatGEM-2 also has an important blind spot.
The satellite sea-level measurements used in the study cannot reliably track the ocean surface beneath sea ice. That means coastal areas where Antarctic Bottom Water actually forms are largely excluded.
scientists are seeing what happens to the deep water after it spreads away from Antarctica. They are not watching every step of how it is created.
There is another puzzle too.
The close timing between changes in sea ice and bottom-water volume may be too fast to simply represent newly formed water traveling across an entire ocean basin.
Instead, the deep ocean may be adjusting through changes in pressure that travel much faster than the water itself.
Imagine squeezing one end of a long tube. The pressure signal can move through it well before the liquid itself travels the same distance.
Something similar may be happening here.
For now, though, that remains a possible explanation rather than a confirmed mechanism.
Why a 3% loss matters
Three percent does not sound huge.
Across an ocean, though, scale matters.
Antarctic Bottom Water is one of the planet’s major climate buffers. It renews the deepest parts of the ocean, carries oxygen downward, stores carbon for long periods, and absorbs heat that would otherwise remain closer to the surface.
Its contraction has also happened alongside warming, freshening, and oxygen loss in the deep ocean.
That combination matters.
Co-author Nathaniel Bindoff said the changes point toward weaker deep-ocean overturning, although the new research cannot determine exactly how much the broader circulation has weakened.
So, is the global ocean conveyor suddenly about to stop? No. That is not what this study says.
The bigger message is quieter, but still important.
A remote ocean system once thought of as extremely slow is changing within decades. And during the most recent part of the record, that change became faster.
Scientists now need to keep watching.
The official study has been published in Geophysical Research Letters.